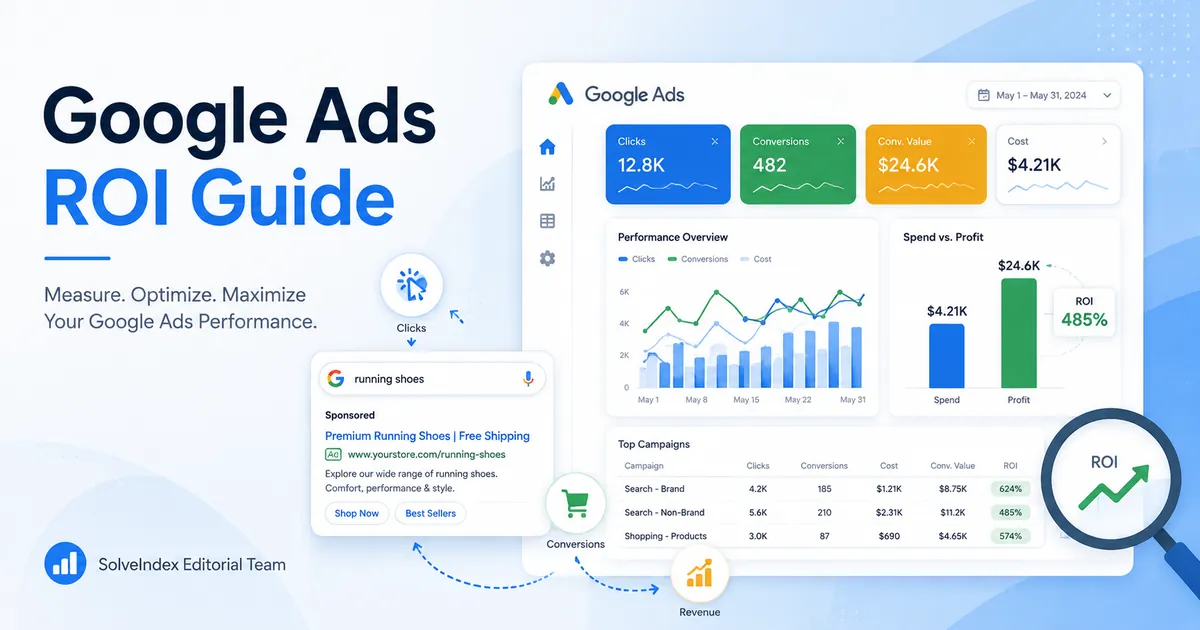
Google Ads can generate traffic and conversions while still failing to create acceptable profit. Revenue ROAS may look strong even when product cost, service delivery, payment fees, refunds, agency charges and overhead leave little money behind. That is why campaign reporting should connect advertising metrics with business economics.
This guide explains ROAS calculation, Google Ads ROI, CPA, CPC, conversion rate and break-even ROAS using the same inputs as the matching calculator. It also explains where the model is simplified, how to use it for ecommerce or lead generation, and how to avoid choosing targets from generic benchmarks.
What This Google Ads Profitability Model Measures
The calculator begins with Google Ads cost, average CPC, conversion rate, average conversion value and gross margin. It estimates clicks, conversions, attributed conversion value, gross profit before advertising, campaign profit after advertising, ad-spend ROI, CPA, ROAS and break-even ROAS.
The model is intentionally focused on campaign economics. It does not automatically include agency retainers, employee time, creative production, landing-page development, tracking software, payment processing, shipping, refunds, taxes or general overhead. Include directly attributable costs consistently or review them in a broader profit-and-loss analysis.
How to Calculate ROAS
Return on ad spend measures attributed conversion value relative to advertising cost. Use values from the same campaign, date range, currency and attribution basis. If Google Ads reports $15,000 in conversion value from $5,000 in cost, the campaign produces a 3.0x ROAS, which can also be written as 300%.
ROAS is a revenue-efficiency metric, not a complete profit metric. It does not subtract the cost of producing or delivering what was sold. A high ROAS can therefore be insufficient for a low-margin business, while a lower ROAS may be profitable for a high-margin offer.
How to Calculate Google Ads ROI
ROI should be defined before it is compared. The matching calculator uses an ad-spend ROI formula: gross profit from attributed conversion value minus Google Ads cost, divided by Google Ads cost. This answers how much campaign profit was generated relative to the advertising spend entered.
A full business ROI can use a wider denominator that includes direct product cost, fulfillment, labor, agency and other investment costs. When comparing reports, confirm whether the denominator is ad spend alone or total cost. The same campaign can produce different ROI percentages under different definitions without either calculation being mathematically wrong.
Google Ads ROI Calculation Example
Assume a search campaign spends $5,000 at an average CPC of $2.50. The budget purchases an estimated 2,000 clicks. At a 3.5% conversion rate, those clicks produce 70 conversions. If each conversion is worth $180, attributed conversion value is $12,600.
At a 45% gross margin, gross profit before advertising is $5,670. Subtracting $5,000 in Google Ads cost leaves $670 in campaign profit. ROAS is 2.52x, CPA is $71.43, break-even ROAS is 2.22x and ad-spend ROI is 13.4%.
| Metric | Calculation | Result |
|---|---|---|
| Clicks | $5,000 / $2.50 | 2,000 |
| Conversions | 2,000 x 3.5% | 70 |
| Conversion value | 70 x $180 | $12,600 |
| Gross profit | $12,600 x 45% | $5,670 |
| Campaign profit | $5,670 - $5,000 | $670 |
| ROAS | $12,600 / $5,000 | 2.52x |
| Ad-spend ROI | $670 / $5,000 | 13.4% |
How CPC Determines Estimated Clicks
Average CPC is the total cost of clicks divided by the number of clicks. It is different from a maximum CPC bid, which is a bidding limit rather than the average amount charged. Use the reported Avg. CPC for the same campaign and date range as the cost entered.
A lower CPC creates more clicks from the same budget, but cheaper traffic is not automatically better. Low-intent clicks can reduce conversion rate and increase CPA. CPC should be evaluated together with conversion quality, conversion value and margin.
How to Calculate Google Ads Conversion Rate
Google Ads conversion rate is conversions divided by eligible ad interactions, usually clicks for a search campaign. The conversion actions included in the Conversions column matter. Counting newsletter signups, calls, purchases and qualified leads together can make the percentage difficult to interpret.
Use one clear conversion goal when forecasting. For lead generation, separate raw form submissions from qualified leads and closed customers. For ecommerce, confirm that purchase tracking is not duplicated across Google Ads, Google Analytics and imported offline events.
How to Calculate Google Ads CPA
Average CPA is Google Ads cost divided by conversions. In this calculator, the same result can be estimated from CPC and conversion rate. A $2.50 CPC and 5% conversion rate imply a $50 CPA because approximately 20 clicks are required for one conversion.
CPA is only meaningful when the conversion definition is valuable. A $20 CPA for an unqualified lead may be worse than a $100 CPA for a customer with strong gross profit. Compare CPA with expected gross profit per conversion, not with an isolated industry average.
How Conversion Value Affects ROAS
Conversion values allow Google Ads reporting and value-based bidding to distinguish between actions that create different business value. Ecommerce advertisers can pass transaction-specific purchase values. Lead-generation advertisers can assign conservative values based on qualification rate, close rate, customer revenue and gross margin.
Avoid assigning full customer lifetime revenue to every lead. A defensible lead value can be estimated by multiplying lead-to-customer rate by expected customer gross profit. Update the value when close rate, pricing, retention or delivery cost changes.
Why Gross Margin Changes Google Ads Profitability
Gross margin represents the share of attributed revenue remaining after direct product or service-delivery costs. Two campaigns can produce the same ROAS and very different profit. At 20% gross margin, a 3.0x ROAS produces only $0.60 of gross profit for each $1 of ad spend, which is below break-even. At 60% margin, the same ROAS produces $1.80 of gross profit per advertising dollar.
Use contribution margin instead of gross margin when variable payment fees, shipping subsidies, fulfillment, commissions, returns or support costs materially change with every conversion.
How to Calculate Break-Even ROAS
Simplified break-even ROAS is 1 divided by gross margin as a decimal. It estimates the revenue multiple required for gross profit to equal ad spend. A 50% margin needs 2.0x, a 40% margin needs 2.5x and a 25% margin needs 4.0x.
This formula excludes costs outside gross margin. If payment fees, fulfillment, returns and other variable costs consume another 10% of revenue, use the resulting contribution margin. Fixed overhead and the desired profit buffer should then push the operating target above pure break-even.
ROAS vs ROI
| Metric | Basic formula | Best use | Main limitation |
|---|---|---|---|
| ROAS | Conversion value / ad spend | Revenue efficiency and value-based bidding | Does not subtract direct costs |
| Ad-spend ROI | Campaign profit / ad spend | Profit contribution relative to media cost | Denominator excludes wider investment costs |
| Full business ROI | Net profit / total investment | Broader financial evaluation | Requires complete cost accounting |
Use the metric that matches the decision. ROAS is useful for campaign management, ad-spend ROI for profit contribution and full ROI for broader investment comparison. Do not label all three as the same number.
What Is a Good ROAS for Google Ads?
A good ROAS exceeds the business-specific break-even level by enough to cover overhead, uncertainty and desired profit. There is no universal target. A 2.0x ROAS can be excellent for an offer with an 80% contribution margin and inadequate for a product that retains only 25% before advertising.
Set three reference points: break-even ROAS, minimum acceptable ROAS and a scaling target. The minimum should cover variable costs and an allocated share of overhead. The scaling target should leave room for CPC increases, conversion-rate changes, refunds and attribution error as spend expands.
What Is a Good CPC or CPA?
A good CPC is one that produces an acceptable CPA and profit. A good CPA is lower than the gross or contribution profit expected from the conversion. The maximum affordable CPA can be calculated from conversion value and margin, then adjusted for overhead and profit requirements.
For example, a customer worth $300 at a 50% contribution margin creates $150 before acquisition cost. If the business requires $50 profit after advertising, the maximum target CPA is $100. At a 4% conversion rate, the corresponding maximum CPC is $4.
How Much Should You Spend on Google Ads?
Budget should reflect the amount needed to produce enough conversions for a meaningful test without risking cash the business cannot afford to lose. Begin with keyword demand, expected CPC, conversion rate and target CPA. A budget that buys only a few clicks cannot reliably test a conversion model.
For planning, estimate monthly clicks from budget and CPC, then conversions from clicks and conversion rate. Run conservative and expected scenarios. Increase budget only when tracking is reliable and marginal conversions remain profitable, rather than assuming current ROAS will stay constant at higher spend.
Target CPA vs Target ROAS
Target CPA bidding focuses on conversion volume at an average cost per action. Target ROAS focuses on conversion value at an average return target. Target CPA is more suitable when conversions have similar value, while Target ROAS is useful when transactions, leads or customers have materially different values.
Both strategies depend on accurate primary conversion actions. Target ROAS also requires meaningful conversion values. Do not use inflated lead values or duplicate purchase tracking simply to make reported ROAS appear stronger. Evaluate achieved results over a period that accounts for conversion lag.
Google Ads ROI for Lead Generation
Lead-generation campaigns need a value bridge between the Google Ads conversion and actual revenue. Record the rate from lead to qualified opportunity, opportunity to customer, average customer revenue, gross margin and sales cycle. A form submission is not worth the full value of a closed customer.
Import qualified and closed outcomes when possible. Compare raw-lead CPA, qualified-lead CPA and customer-acquisition cost separately. This prevents campaigns with cheap but low-quality leads from receiving more budget than campaigns that generate fewer, more valuable opportunities.
Google Ads ROI for Ecommerce
Ecommerce advertisers should use net sales after discounts and refunds where possible, accurate order values and a margin that includes product cost. Shipping, payment processing, marketplace charges and returns can make contribution margin materially lower than gross margin.
Analyze product groups separately when margins differ. A blended account ROAS can hide high-margin products funding low-margin products. Use the Ecommerce ROI Calculator or Shopify ROI Calculator when platform, fulfillment and store operating costs need dedicated inputs.
Attribution, Conversion Lag and Reporting Periods
Google Ads cost is recorded immediately, while conversions may occur and be reported later. Recent periods can therefore appear weaker before conversion data matures. Use a reporting window appropriate to the buying cycle and avoid comparing cost from one period with conversion value from another.
Attribution settings can change which campaign receives credit. Keep the same attribution model and conversion definitions when comparing periods. Reconcile Google Ads values with ecommerce, CRM and accounting records, understanding that systems can differ because of attribution, time zones, refunds and tracking consent.
How to Improve ROAS and Google Ads ROI
- Remove wasted search terms. Add negatives and tighten targeting around queries that produce valuable conversions.
- Improve conversion tracking. Optimize toward purchases, qualified leads and other primary actions with verified values.
- Raise landing-page conversion rate. Match the query, ad, offer and page while improving speed, mobile usability and trust.
- Improve conversion value. Test pricing, bundles, upsells, lead qualification and retention without overstating attribution.
- Protect margin. Separate campaigns by product, service, location or customer group when economics differ.
- Review marginal performance. Compare the additional conversions and profit created after a budget increase, not only the account average.
Lower CPC can help, but it is only one lever. Increasing conversion rate, customer value or margin can improve both CPA and ROI even when CPC remains unchanged.
Are Google Ads Worth It?
Google Ads is worth using when it reaches relevant demand, produces measurable conversions and creates acceptable profit after acquisition and delivery costs. It may not be worth scaling when tracking is unreliable, search intent is weak, the offer does not convert or the margin cannot support the required CPA.
Use a controlled test with documented assumptions. Define the conversion, value, gross margin, maximum CPA and minimum ROAS before launch. After enough data accumulates, compare actual performance with the forecast and decide whether to improve, narrow, pause or scale.
Common Google Ads Profitability Mistakes
- Using maximum CPC bid instead of reported average CPC.
- Mixing campaign cost, CPC and conversion rate from different date ranges.
- Counting low-value micro-conversions as customers.
- Using revenue ROAS as proof of profit.
- Entering 100% margin when products or services have direct costs.
- Ignoring refunds, shipping, payment fees, agency costs and overhead.
- Using all store revenue as paid-search conversion value.
- Judging recent data before conversion lag has matured.
- Applying one blended target to campaigns with different margins and values.
Google Ads ROI FAQs
Sources and Methodology
This guide was reviewed on July 27, 2026. Metric definitions and bidding context were checked against official Google Ads documentation for average CPC, conversion rate, average CPA, advertising ROI, conversion values and Target ROAS bidding.
The SolveIndex calculator uses a transparent planning model based on user-entered values. It does not access a Google Ads account, forecast auction outcomes or guarantee campaign results. Use actual reports and professional accounting or advertising advice for material decisions.