ROAS is a compact way to compare advertising value with advertising cost. It is useful because it answers a focused question: for every unit of currency spent on ads, how much attributed revenue or conversion value came back? The metric is simple to calculate, but a useful interpretation depends on scope, attribution, conversion values, margins and the business objective behind the campaign.
The matching ROAS Calculator handles the arithmetic and target scenario. This guide owns the informational questions around ROAS meaning, the ROAS formula, how to calculate ROAS, what a good ROAS depends on, target ROAS and how to improve the metric without confusing it with profit or ROI.
What Is ROAS?
ROAS stands for return on ad spend. It measures attributed revenue or conversion value divided by advertising cost. A 3.0x ROAS means the selected advertising scope produced $3 of attributed value for every $1 spent on ads. The same ratio can be written as 300%.
The word attributed matters. ROAS is not automatically the same as total revenue generated during a period. The numerator should represent the value credited to the advertising activity being measured. If the spend covers one campaign but the revenue includes unrelated channels, the ratio no longer answers a clean advertising-efficiency question.
ROAS Meaning in Marketing
In marketing reporting, ROAS sits near the bottom of the paid-media funnel because it connects campaign cost with attributed value. CTR connects impressions to clicks. CPC prices those clicks. Conversion rate connects visits or clicks to outcomes. CPA prices conversions. ROAS then compares the value assigned to those outcomes with the advertising cost required to generate them.
That makes ROAS an advertising value-efficiency metric rather than a complete business profitability metric. It can help compare campaigns, diagnose changes in monetization, set value-based bidding targets and decide where to investigate. It cannot tell you by itself whether product cost, fulfillment, payroll, payment processing, refunds and overhead leave a positive profit.
Return on Ad Spend Formula
The core ROAS formula has no universal currency. If both inputs use the same currency and scope, the ratio is comparable as a multiple. A campaign with 15,000 in attributed value and 5,000 in advertising cost has the same 3.0x ROAS whether those values are expressed in USD, GBP, CAD or AUD.
How to Calculate ROAS
- Choose the campaign, account segment or paid-media scope you want to measure.
- Use advertising cost from that exact scope and reporting period.
- Use attributed revenue or conversion value from the same scope.
- Divide attributed value by ad spend.
- Express the result as a multiple such as 3.0x, or multiply by 100 for the percentage form.
- Compare the result with a business-specific target only after checking margin, attribution and conversion quality.
For a quick calculation, enter the two values in the free online ROAS calculator. For analysis, keep a record of the attribution model, conversion actions, value rules and reporting window used so the next period is genuinely comparable.
ROAS Multiple vs Percentage
ROAS is commonly shown in two equivalent formats. A 2.5x ROAS is 250%, 3.0x is 300%, 4.0x is 400% and 5.0x is 500%. The multiple is often easier for business interpretation because it reads directly as value per $1 of spend. The percentage form is especially important in Google Ads Target ROAS settings.
| ROAS multiple | ROAS percentage | Plain-language meaning |
|---|---|---|
| 1.0x | 100% | $1 attributed value per $1 ad spend |
| 2.0x | 200% | $2 attributed value per $1 ad spend |
| 3.0x | 300% | $3 attributed value per $1 ad spend |
| 5.0x | 500% | $5 attributed value per $1 ad spend |
ROAS Calculator Inputs
| Input | Use this definition | Avoid this mistake |
|---|---|---|
| Advertising cost | Media cost for the same campaign or portfolio and period. | Mixing one channel's spend with all-company revenue. |
| Attributed revenue or conversion value | Value credited to conversions inside the same reporting scope. | Switching between gross sales, modeled value and profit without noting it. |
| Target ROAS | A planning or bidding target supported by economics and historical performance. | Copying an industry number as a universal pass or fail threshold. |
If a platform reports conversion value rather than literal sales revenue, use the value definition actually configured for that conversion action. A lead-generation account may assign estimated values to qualified leads. An ecommerce account may report purchase value. Those can both support ROAS analysis, but they are not identical business events.
Worked ROAS Calculation
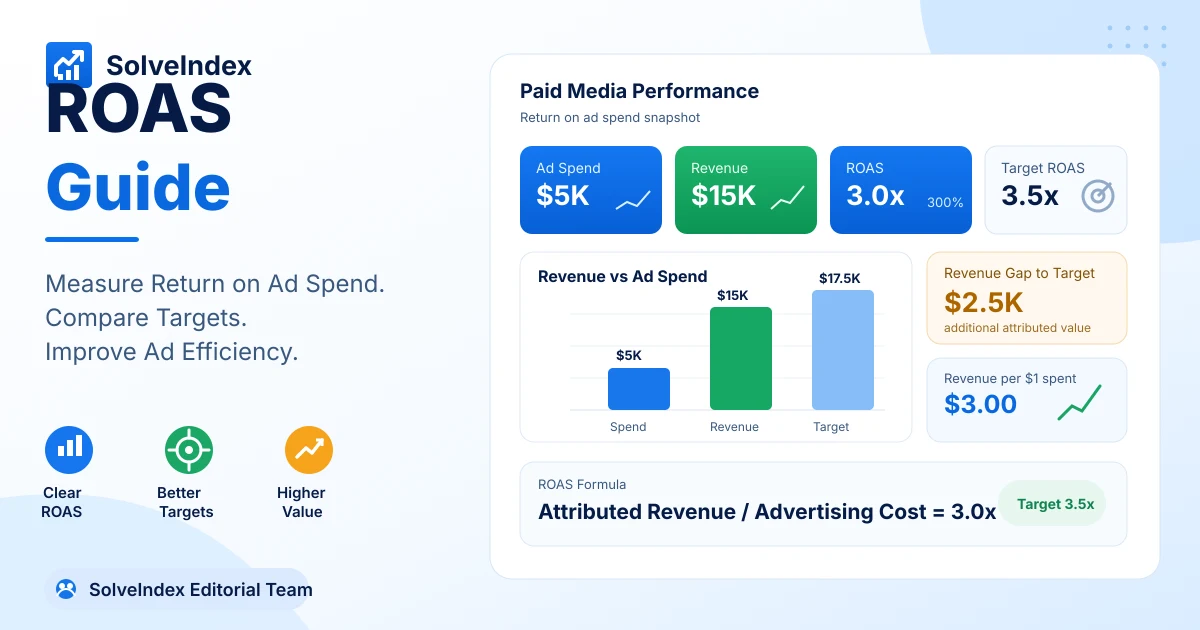
Suppose an advertising campaign spends $5,000 and records $15,000 in attributed revenue. The ROAS calculation is 15,000 / 5,000 = 3.0x, or 300%. The campaign therefore returns $3 of attributed revenue for every $1 of ad spend.
If the business sets a 3.5x target while holding spend at $5,000, target revenue is $17,500. The current $15,000 result is $2,500 below that target. This is a scenario comparison, not a forecast. Raising the target does not guarantee that the auction, traffic mix or conversion value will respond in a way that produces the required revenue.
What Does 3x ROAS Mean?
A 3x ROAS means attributed value equals three times advertising cost. It does not mean the campaign created a 200% profit margin, and it does not mean $2 of every $3 is profit. The business still has to pay the costs associated with producing and delivering the product or service, plus any wider operating costs that sit outside media spend.
This distinction is why the calculator labels revenue less ad spend as not profit. That difference can be useful for orientation, but a profitability conclusion requires margin and cost data.
What Is a Good ROAS?
There is no universal good ROAS that applies to every advertiser. A useful target depends on contribution margin, variable costs, repeat purchase behavior, customer lifetime value, cash-flow constraints, growth objectives, attribution quality and the amount of scalable demand available at that efficiency level.
For example, a high-margin digital product can tolerate a lower revenue multiple than a low-margin physical product if both businesses want the same profit contribution after advertising. A subscription business may accept a lower first-purchase ROAS when retention economics are strong. A cash-constrained retailer may need a higher immediate return even when long-term customer value would support more aggressive acquisition.
The strongest reference point is therefore not a generic online claim. Start with your own break-even economics, then compare similar campaigns and historical periods. A ROAS is useful when it supports the business objective behind the spend, not simply because it is higher than an unrelated benchmark.
Average ROAS and Benchmark Limits
Searches for average ROAS and ROAS benchmarks are common, but the underlying samples can be difficult to compare. One benchmark may use ecommerce purchase revenue, another may use platform conversion value, another may blend industries, and another may measure a different attribution window or paid channel. Even within one advertiser, brand campaigns and non-brand prospecting can have very different ROAS distributions.
Treat external averages as context rather than a universal threshold. Document the channel, geography, industry, attribution model, conversion-value definition, customer stage and time period before comparing your account with an external sample. If those dimensions differ materially, the benchmark may be descriptive without being actionable.
A Better ROAS Benchmark Framework
A practical ROAS benchmark has three layers. First, determine the minimum return supported by your economics. Second, compare the campaign with its own similar historical segments. Third, use external industry research only as a broad reference. This order prevents a market average from overruling your actual margin structure.
- Business floor: What return is required before advertising destroys contribution?
- Historical comparator: How did similar campaigns, audiences, devices and periods perform?
- Growth target: What efficiency level lets the business scale without violating margin or cash constraints?
- External context: Does reputable benchmark research suggest your result is unusual for a genuinely comparable sample?
For the first layer, use the dedicated Break-Even ROAS Calculator. It owns the minimum-ROAS and margin-based threshold question so the generic ROAS guide can stay focused on measurement and interpretation.
What Is Target ROAS?
Target ROAS is the average value-to-cost ratio an advertiser wants to achieve. It can be used as an internal planning target or as an input to value-based bidding systems. A target should reflect the result the business can economically support, not an arbitrary desire for the highest possible efficiency.
A target that is too low can allow spend that does not support the business objective. A target that is too high can also create a problem if it restricts traffic and prevents the advertiser from capturing profitable demand. The decision is therefore a tradeoff between efficiency, volume and the economics of the next incremental conversion.
Google Ads Target ROAS: 500% vs 5x
Google Ads expresses Target ROAS as a percentage. Google gives the example that a goal of $5 in conversion value for each $1 spent corresponds to a 500% Target ROAS. In multiple form, that is 5.0x. The SolveIndex calculator accepts the multiple form, so enter 5.0 for 500%, 4.0 for 400% and 3.5 for 350%.
Google explains that Target ROAS bidding uses reported conversion values and tries to achieve an average conversion value per cost equal to the selected target. Google also notes that the target can affect total conversion value and traffic, which is another reason not to treat a higher target as automatically better.
Historical ROAS vs Target ROAS
Historical ROAS is a measurement of what happened. Target ROAS is a goal or bidding constraint. Do not rewrite historical performance by substituting a target into the formula. The correct workflow is to calculate actual ROAS first, then compare it with a separately chosen target.
Google recommends using business goals and historical ROAS performance as references when setting Target ROAS. Historical data should also account for conversion delay so the most recent incomplete days do not make performance look artificially weak.
ROAS vs ROI
ROAS and ROI answer different questions. ROAS compares attributed advertising value with ad spend. ROI normally compares profit or net return with the selected investment or cost base. A campaign can have a ROAS above 1.0x and still have negative ROI if gross margin and other costs consume the revenue remaining after ad spend.
| Metric | Numerator | Denominator | Main question |
|---|---|---|---|
| ROAS | Attributed revenue or conversion value | Advertising cost | How much attributed value came back per unit of ad spend? |
| ROI | Profit or net return | Selected investment or cost base | Was the investment profitable after the relevant costs? |
For paid-search profit analysis, use the Google Ads ROI Calculator. For broader campaign economics, use the Marketing ROI Calculator. Those pages own profit and ROI intent rather than the generic ROAS formula.
ROAS vs Break-Even ROAS
Actual ROAS tells you the observed attributed value per unit of ad spend. Break-even ROAS estimates the minimum multiple needed to cover advertising spend after considering the contribution available from revenue. The two numbers become useful together: actual ROAS provides the measurement, while break-even ROAS provides an economic floor.
Keep the concepts separate in reporting. Calling the current ROAS a break-even target without using margin data can hide a profitability problem. The dedicated Break-Even ROAS Guide explains the margin-based formula and edge cases in detail.
ROAS vs CPA, CPC and Conversion Rate
ROAS often moves because another funnel metric changed. A higher CPC can reduce ROAS if conversion rate and value stay constant. A stronger conversion rate can improve ROAS even when CPC rises. Higher average conversion value can improve ROAS without changing conversion volume. That is why a ROAS change should trigger diagnosis rather than an immediate conclusion.
- CPC measures advertising cost per click.
- CPA measures advertising cost per conversion or acquisition.
- Conversion rate measures the share of traffic that completes the selected outcome.
- ROAS measures attributed value relative to advertising cost.
When ROAS falls, decompose the change into traffic cost, conversion efficiency and value per conversion before deciding which lever to change.
Attribution and ROAS
Attribution determines how conversion credit is assigned to ad interactions, so attribution settings can change reported ROAS even when the underlying customer journey has not changed. Google Ads currently supports data-driven attribution and last-click attribution for relevant conversion actions, and the selected attribution model affects conversion reporting and bid strategies that optimize to conversion value.
This is especially important when comparing periods. If the attribution model, creditable channels or conversion action settings change, label the change in your reporting. A before-and-after ROAS comparison can otherwise mix two measurement systems.
Conversion Value and Value Rules
Google Ads conversion values let advertisers assign business value to conversions rather than count every conversion as equal. Target ROAS bidding requires conversion values because the strategy optimizes conversion value relative to cost. Value rules can further adjust reported values for dimensions such as audiences, devices or locations when those differences represent real business value.
For ROAS analysis, document whether the numerator is literal purchase revenue, lead value, modeled value, margin-adjusted value or another business value. Two campaigns can report the same 4.0x ROAS while representing very different economic outcomes if their conversion-value definitions differ.
Refunds, Returns and Value Adjustments
ROAS can look strongest before refunds, cancellations or downstream quality adjustments are reflected. Ecommerce teams should reconcile platform-reported conversion value with returned orders and net revenue where practical. Lead-generation teams should check whether assigned lead values still match actual qualification and close rates.
If the business updates conversion values after the original interaction, the reported ROAS for an older period can change. That is not necessarily an error. It can be a more complete measurement of the value ultimately credited to the campaign.
ROAS for Ecommerce
Ecommerce ROAS is often calculated from purchase revenue divided by ad spend, but a good ecommerce ROAS still depends on product margin, discounting, shipping subsidies, payment fees, returns and repeat-purchase economics. A store with a 2.5x ROAS can be healthier than a store with a 4.0x ROAS if the first store has stronger margins and scales much more volume profitably.
Use the generic ROAS ratio to measure advertising value efficiency, then move to the Ecommerce ROI Calculator or Ecommerce Profitability Guide when the question becomes total store profit. This prevents the ROAS page from absorbing a separate ecommerce-profitability intent.
How to Improve ROAS
To improve ROAS, either increase attributed value faster than advertising cost or reduce advertising cost without losing too much valuable conversion volume. The best lever depends on why the current ratio is weak. A low ROAS caused by expensive irrelevant clicks needs a different response from a low ROAS caused by a weak landing page or low average order value.
Start with diagnosis. Segment performance, identify the mathematical driver of the change and then test the smallest intervention that addresses that driver. This avoids the common mistake of cutting spend from a campaign that could become valuable through better conversion rate or higher conversion value.
Increase Conversion Value
ROAS improves when conversion value rises while spend remains stable. Ecommerce teams can test merchandising, bundles, cross-sells, pricing, promotional structure and product mix. Lead-generation teams can improve value definitions by distinguishing qualified leads from low-intent submissions and aligning bidding with downstream customer value.
Do not inflate conversion values merely to make ROAS look better. The values should reflect real business priorities. If a value rule or modeled value changes, document it so historical comparisons remain interpretable.
Improve Conversion Efficiency
A higher conversion rate can improve ROAS because more of the paid traffic generates value. Useful tests include stronger message match between ad and landing page, clearer offers, faster mobile performance, simpler checkout or lead forms, better product information and fewer trust barriers. Judge the change by conversion quality as well as conversion count.
If conversion rate improves only because the conversion definition became easier, ROAS may not reflect a real business improvement. Keep the value and conversion-action definitions stable when evaluating experiments.
Reduce Wasted Ad Spend
ROAS can also improve by reducing spend that generates little value. Depending on the channel, that may involve search-term cleanup, negative keywords, audience exclusions, placement controls, geographic or device adjustments, budget reallocation and better creative-to-audience matching. The goal is not simply cheaper traffic. It is less cost for the same or greater valuable output.
Be careful with aggressive cuts. A very high ROAS can be produced by serving only the easiest existing demand while leaving profitable incremental demand uncaptured. Track total value and contribution alongside efficiency when scaling decisions matter.
Segment ROAS Before Acting
Account-wide ROAS can hide important differences. Segment by campaign objective, brand vs non-brand demand, product category, audience, device, geography, new vs returning customer and time period where the data volume supports it. Compare segments that serve similar business purposes instead of ranking every campaign by one blended number.
A portfolio can intentionally contain lower-ROAS acquisition campaigns and higher-ROAS retention or brand campaigns. The correct decision depends on the role each segment plays and whether its economics meet the relevant business threshold.
Common ROAS Mistakes
- Using total company revenue as the numerator while using only one channel's advertising cost.
- Calling revenue minus ad spend profit without subtracting the other costs required to deliver the sale.
- Treating ROAS and ROI as interchangeable metrics.
- Using a universal good ROAS target without checking margin or customer economics.
- Comparing periods after changing attribution models, conversion actions or conversion-value rules without noting the change.
- Chasing the highest possible ROAS even when a lower but still profitable ratio could create more total contribution.
- Ignoring conversion lag, refunds, cancellations or delayed value adjustments.
- Comparing brand, prospecting and retargeting campaigns as if they faced the same intent and demand conditions.
Practical ROAS Workflow
- Define one coherent advertising scope and reporting period.
- Confirm which conversion actions and conversion values are included.
- Match attributed value with advertising cost from the same scope.
- Calculate current ROAS as both a multiple and percentage.
- Compare the result with the relevant break-even threshold and business target.
- Segment the result by campaign type, audience, device, geography or product when volume allows.
- Diagnose changes through CPC, conversion rate, conversion value and CPA.
- Choose one improvement lever and test it without silently changing the measurement definition.
- Reconcile platform value with downstream revenue, refunds, margin and actual profit before making major budget decisions.
For recurring reporting, save the assumptions beside the number. A ROAS of 4.2x is much more useful when the report also states the attribution model, conversion-value definition, campaign scope and date range used to produce it.
Frequently Asked Questions
Sources and Methodology
SolveIndex cross-checked Google Ads platform behavior against current first-party documentation: Target ROAS bidding, conversion values, attribution models, and incremental ROAS in Conversion Lift measurement. Google describes standard ROAS in that measurement context as overall attributed conversion value divided by total spend, while incremental ROAS isolates incremental conversion value.
Reviewed on September 3, 2026. The SolveIndex calculator uses transparent arithmetic and does not access an advertising account, predict auction outcomes or provide a universal good-ROAS threshold. Benchmark and target guidance in this article is methodological: use comparable internal data and business economics before external averages.
Use the ROAS Calculator
Calculate return on ad spend from your own advertising cost and attributed value, then compare an optional target without confusing the ratio with profit.
Open the ROAS Calculator