Break-even ROAS answers a narrower question than ordinary return on ad spend: how much attributed revenue is required for each advertising dollar so the contribution from the measured sales can cover the ad cost. It is a business-side profitability threshold, not a platform benchmark and not a promise that the company has reached net profit.
The matching Break-Even ROAS Calculator owns the direct calculation intent. This guide explains the formula, the margin choice behind it, the difference between break-even and Target ROAS, and the cost decisions that make a threshold useful in real advertising planning.
What Is Break-Even ROAS?
Break-even ROAS is the minimum revenue multiple needed so the contribution remaining after non-ad variable costs equals advertising spend. If the threshold is 2.86x, the modeled sales need about $2.86 of revenue for each $1 of ad spend before the contribution from those sales has fully paid for that advertising dollar.
The term is also written as breakeven ROAS. It is not a standard Google Ads metric with one universal formula built into the platform. It is a planning model that connects advertising efficiency with business margin. Google Ads reports conversion value and cost, while the advertiser must decide which product costs, fees and other economics are relevant to the threshold.
That distinction matters because a campaign can show a 3.0x actual ROAS and still lose money for a low-margin offer, while another offer with stronger contribution margin could be economically viable at a lower ROAS. The revenue multiple has meaning only after the underlying margin is defined.
Why Margin Determines Break-Even ROAS
Advertising is paid from the portion of revenue that remains after the other variable costs of producing and fulfilling the sale. If a business keeps 50 cents of contribution from each revenue dollar before advertising, it can spend up to 50 cents on ads for that dollar of revenue and reach contribution break-even. That corresponds to a 2.0x break-even ROAS.
If only 25 cents remains from each dollar before advertising, the same business can spend only 25 cents on ads per revenue dollar. It therefore needs $4 of revenue for each $1 of ad spend, which is a 4.0x break-even ROAS. Lower margin creates a higher required revenue multiple because less contribution is available to pay for media.
Break-Even ROAS Formula
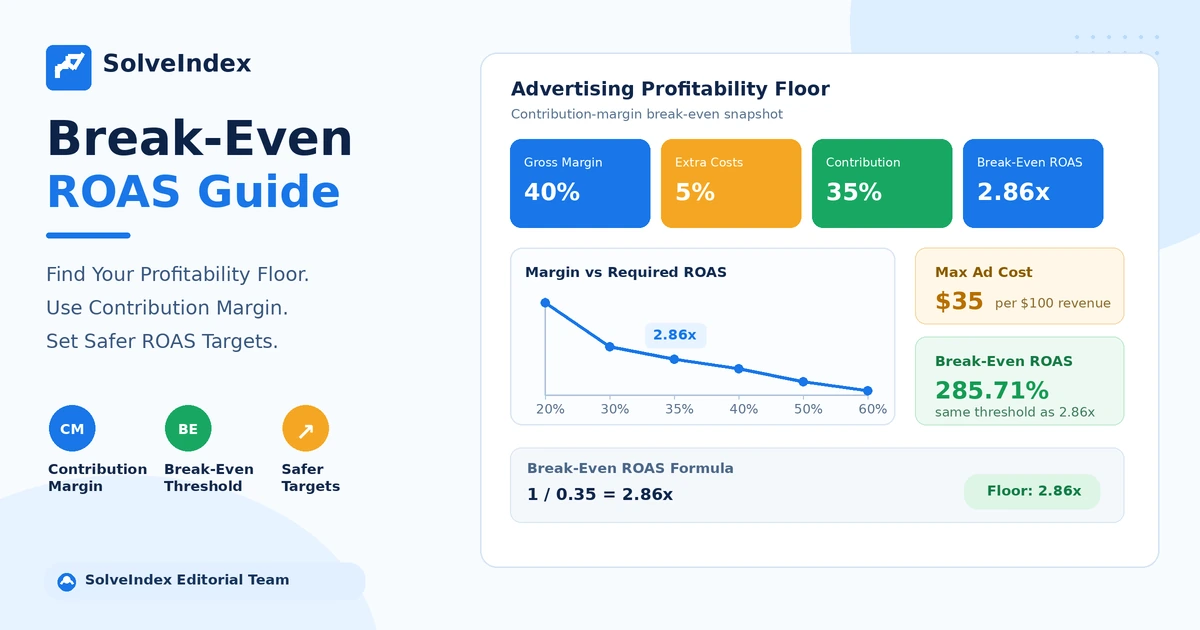
For example, a 35% contribution margin becomes 0.35 as a decimal. One divided by 0.35 is approximately 2.857, so the break-even ROAS is about 2.86x, or 285.71%. The same threshold means no more than about $35 of ad cost for every $100 of revenue under the assumptions in the model.
Gross Margin Formula
Gross margin is the share of net sales revenue left after cost of goods sold or direct production and service-delivery costs. A simplified calculation is:
Shopify describes gross margin as the portion of net sales left after COGS and distinguishes it from contribution margin, which can include variable costs that sit outside COGS. This distinction is useful for paid media because payment processing, variable fulfillment, return allowances or sales commissions can reduce the money actually available to fund advertising even when product gross margin has not changed.
Contribution Margin Formula
Contribution margin focuses on what remains after variable costs that change with the sale. For a percentage-based ROAS model, the practical question is how much of each revenue dollar is left before advertising and fixed overhead.
The SolveIndex calculator starts with gross margin and subtracts an optional additional variable-cost rate. This prevents the page from pretending that every business classifies costs in the same accounting line. If the gross margin input already includes all relevant variable costs, the additional rate can stay at zero.
Gross Margin vs Contribution Margin
The common shortcut of one divided by gross margin is useful only when gross margin is a good proxy for the contribution available before advertising. In ecommerce, that shortcut can be too optimistic when payment fees, shipping subsidies, variable warehouse charges, returns or marketplace fees are not included in COGS.
| Margin basis | When it can work | Main risk |
|---|---|---|
| Gross margin only | COGS captures the relevant direct variable economics and other variable selling costs are immaterial. | Overstates the amount available for advertising when extra variable costs are excluded. |
| Contribution margin before ads | You can identify variable costs that scale with the sale and remove them before advertising. | Still does not automatically cover fixed overhead or desired profit. |
| Net profit margin | Useful for broader company profitability analysis. | Can mix fixed costs into a percentage that changes with revenue and may not isolate marginal ad economics cleanly. |
How to Calculate Break-Even ROAS
- Choose one product, product group, campaign scope or weighted portfolio whose economics are reasonably consistent.
- Calculate gross margin after COGS or direct service-delivery costs.
- Identify additional non-ad variable costs that are not already inside gross margin.
- Subtract those costs from gross margin to find contribution margin before advertising.
- Convert the contribution margin percentage to a decimal.
- Divide 1 by that decimal to calculate break-even ROAS.
- Compare actual attributed ROAS with the break-even floor, then add any profit or risk cushion before setting an operating target.
The calculation is simple enough to reproduce without software. The difficult part is defining costs without double counting them and matching the margin basis to the revenue being attributed to the ads.
Worked Break-Even ROAS Example
Assume an online business has a 40% gross margin after product cost. It also expects payment processing, variable fulfillment and return-related costs equal to 5% of revenue that are not already inside gross margin. Effective contribution margin before advertising is therefore 35%.
At $100 of attributed revenue, $35 is available to cover advertising. Spending more than $35 would push the modeled transaction contribution below zero. At $1,000 of attributed revenue, the equivalent maximum ad cost is about $350. The same economics can be expressed as 2.86x, 285.71%, or $2.86 revenue required per $1 of ad spend.
What Is Break-Even ROAS at 40% Margin?
If 40% is the full contribution margin before advertising and there are no additional variable costs, break-even ROAS is 1 / 0.40 = 2.50x. If the business has another 5% of variable costs outside that margin, contribution falls to 35% and break-even ROAS rises to about 2.86x.
This is why a statement such as "my gross margin is 40%, so my break-even ROAS is 2.5x" should always be followed by a cost-definition check. The shortcut can be right, but only when the 40% margin already represents the amount available before advertising.
Break-Even ROAS by Margin
The relationship is nonlinear. As contribution margin gets thinner, the required ROAS rises quickly.
| Contribution margin before ads | Break-even ROAS | Break-even ROAS % | Max ad cost per $100 revenue |
|---|---|---|---|
| 20% | 5.00x | 500% | $20 |
| 25% | 4.00x | 400% | $25 |
| 30% | 3.33x | 333.33% | $30 |
| 35% | 2.86x | 285.71% | $35 |
| 40% | 2.50x | 250% | $40 |
| 50% | 2.00x | 200% | $50 |
| 60% | 1.67x | 166.67% | $60 |
| 70% | 1.43x | 142.86% | $70 |
This table is mathematical, not a benchmark. It does not say that any listed ROAS is good for a particular industry. It shows the threshold implied by a selected contribution margin before advertising.
Actual ROAS vs Break-Even ROAS
Actual ROAS measures attributed conversion value divided by advertising cost. Break-even ROAS is a threshold derived from business economics. One is observed campaign efficiency; the other is the minimum value-to-cost ratio your margin assumptions require.
| Metric | Question answered | Example |
|---|---|---|
| Actual ROAS | How much attributed value did the ads generate per dollar spent? | $15,000 value / $5,000 spend = 3.0x |
| Break-even ROAS | What minimum revenue multiple is needed so contribution can cover ad spend? | 35% contribution margin = about 2.86x |
| Headroom | How far is actual efficiency above the modeled floor? | 3.0x actual is 0.14x above a 2.86x floor |
A small amount of headroom can disappear when returns, product mix or attribution changes. That is why operating directly at the mathematical floor is usually a riskier policy than using the floor as one input to a broader target.
Break-Even ROAS vs Target ROAS
Break-even ROAS is not automatically the Target ROAS you should use. Break-even represents a modeled zero-contribution point after the included variable costs and advertising. A target is the efficiency level you choose to pursue after considering fixed overhead, profit objectives, cash flow, measurement uncertainty, growth goals and the amount of demand available at different efficiency levels.
For example, if break-even is 2.86x, choosing a 2.86x operating target leaves no modeled contribution cushion for fixed overhead or profit. A business might decide it needs 3.3x, 3.5x or another value, but that additional target must come from its economics and strategy rather than an arbitrary industry average.
Google Ads Target ROAS Context
Google Ads Target ROAS is a Smart Bidding goal that tries to achieve an average conversion value per cost equal to the target while maximizing conversion value. Google explains that a 500% Target ROAS corresponds to $5 of conversion value for each $1 of ad spend, which is the same ratio as 5.0x.
Google also recommends setting Target ROAS with business goals and historical ROAS performance as references. Break-even ROAS can inform the business-goal side of that decision, but the two concepts should not be merged. The break-even threshold comes from your cost structure; Google Ads bidding responds to the conversion values, auction signals and target you provide.
Break-Even ROAS vs ROI
ROAS compares advertising value with ad spend. ROI goes further into profit and the cost base selected for the investment calculation. Google Ads describes ROI in terms of profit relative to costs and emphasizes that business costs matter. That is why a campaign being above break-even ROAS under a contribution model is not identical to the whole business earning a positive ROI.
Use the dedicated ROAS Calculator for observed return on ad spend, the Google Ads ROI Calculator for a broader profit-oriented advertising view, and this break-even model for the margin-based floor between them.
Minimum ROAS vs Profitable ROAS
Searchers sometimes call break-even ROAS the minimum profitable ROAS. The phrase is understandable, but it can hide an important distinction. At true break-even under the selected model, contribution after advertising is approximately zero. Zero contribution is not the same as a meaningful profit.
A profitable operating ROAS usually needs to be above the mathematical floor unless the margin input has already been adjusted to reserve the desired profit and all relevant costs. Treat break-even as the lowest modeled threshold, then define the amount of headroom required by the business.
How Fixed Overhead Changes the Decision
The SolveIndex calculator is intentionally a contribution-margin model. It does not turn rent, salaried payroll, software subscriptions, insurance or other fixed overhead into a percentage of revenue automatically. Fixed costs do not always move in direct proportion to each sale, so forcing them into the same variable-cost formula can create a false sense of precision.
If the purpose is company-level profitability, estimate how much contribution is needed to cover fixed overhead over the relevant period and add that requirement to the planning target. Alternatively, use an ROI or profit model that accepts the actual fixed-cost amounts directly.
Adding a Profit Cushion
A business can reserve a desired contribution after advertising by reducing the margin available for media. Suppose contribution before ads is 35% of revenue and management wants 10% of revenue to remain after advertising. Only 25% is then available for ad cost, so the corresponding operating threshold becomes 1 / 0.25 = 4.0x.
This is a planning choice, not a universal formula for target ROAS. Profit goals can be defined as percentages of revenue, dollars per order, customer lifetime contribution or portfolio-level objectives. The key is to state which layer of profit is being protected instead of labeling every value above break-even as equally attractive.
Product Mix and Weighted Margin
A blended break-even ROAS can be misleading when products have very different margins. If paid traffic shifts toward a lower-margin product, the threshold can rise even when account-level ad metrics look stable. The reverse can happen when higher-margin products make up more attributed revenue.
For a portfolio, use a revenue-weighted contribution margin for the product mix actually being advertised, or calculate separate break-even thresholds by product group. Recalculate after promotions, merchandising changes or inventory constraints materially change the mix.
Discounts, Returns and Refunds
Discounts can reduce both revenue and margin, while returns can reverse value after the ad interaction was initially credited. If your reported conversion value is gross of discounts or refunds but your margin assumptions reflect net realized sales, the numerator and cost economics are not aligned.
Use net sales when possible and include an expected return or refund rate when it is a predictable variable cost that is not already reflected in revenue or gross margin. Avoid subtracting the same economic effect twice.
Payment and Fulfillment Costs
Payment processing, marketplace commissions, pick-and-pack charges, variable shipping subsidies and similar per-order expenses can materially change contribution margin. A store with 45% gross margin might have only 36% contribution before ads after these costs are included, raising break-even ROAS from 2.22x to 2.78x.
Use the additional variable-cost field only for costs not already included in gross margin. The objective is a complete but non-duplicated contribution margin before advertising.
Break-Even ROAS for Ecommerce
Ecommerce is a common use case because revenue, product cost and ad spend can often be measured at an order or product-group level. A practical ecommerce model starts with net sales, subtracts COGS, then subtracts other variable order costs that are not already captured. The remaining contribution percentage becomes the denominator for the break-even ROAS calculation.
Do not assume one ecommerce benchmark. Product category, discounting, return rates, shipping policy, repeat purchase behavior and market-specific costs can create very different thresholds. For broader store economics including COGS, operating expenses and ROI, use the Ecommerce ROI Calculator and its profitability guide.
Break-Even ROAS for Dropshipping
The same arithmetic can be used for dropshipping, but the margin input must reflect the actual supplier, payment, shipping, refund and platform economics of the offer. Supplier price alone is not the complete variable cost. Chargebacks, shipping subsidies or high refund rates can materially reduce the contribution available for acquisition.
Semrush data supplied for this optimization also surfaced long-tail searches for a break-even ROAS calculator for dropshipping. That demand is relevant to the calculator, but it does not justify a separate formula. The correct approach is to use the same contribution-margin model with accurate dropshipping costs rather than inventing a channel-specific benchmark.
Services and Lead Generation
Break-even ROAS is easier to interpret when conversions have direct revenue values. For services or lead generation, the value credited to a lead should reflect expected realized revenue or contribution, not the face value of a possible future contract. Otherwise the ROAS numerator can be too optimistic.
An alternative is to work through CPA and close-rate economics. If the question is allowable cost per conversion rather than revenue multiple, the CPA Calculator is usually the cleaner metric.
Attribution and Revenue Scope
Break-even ROAS is only as useful as the value being compared with ad spend. Google Ads conversion values can represent sales revenue, profit-related values or other business values depending on configuration. If attributed conversion value changes because tracking, attribution, conversion windows or value rules change, observed ROAS can move even when underlying unit economics stay the same.
Keep actual ROAS and break-even ROAS on compatible scopes. Do not compare campaign ad spend with total company revenue, or a product-specific contribution margin with unrelated account-wide conversion value, unless the blended methodology is documented and intentional.
Segment Before You Blend
A useful threshold can differ by product, country, customer type, device, marketplace or campaign because both margin and attributed value can change. Shipping and taxes can differ by market. New-customer campaigns can have different economics from remarketing. Product groups can carry different return rates and COGS.
Start with the smallest segment that has reliable data and material economic differences. Blend only when the weighted average genuinely represents the decisions being made. A single account-wide break-even ROAS is convenient, but convenience should not replace economic consistency.
Common Break-Even ROAS Mistakes
- Using gross margin when important variable selling costs sit outside COGS.
- Subtracting payment fees, returns or fulfillment twice because they are already included in the margin input.
- Calling break-even ROAS a profitable target without leaving room for overhead or desired profit.
- Comparing attributed revenue from one scope with margin from another product or market.
- Using gross sales instead of net realized sales when discounts and returns are material.
- Applying one blended threshold to products with sharply different margins.
- Confusing break-even ROAS with generic ROAS, Target ROAS or ROI.
- Keeping the same threshold after pricing, supplier cost, shipping or refund behavior changes.
How to Lower the Required Break-Even ROAS
Because break-even ROAS is the reciprocal of contribution margin, improving contribution margin lowers the required revenue multiple. That can happen through higher net selling price, lower COGS, lower payment or marketplace fees, better shipping economics, fewer returns, lower variable fulfillment costs or a more favorable product mix.
This is different from improving actual ROAS through advertising optimization. Better creative, targeting, conversion rate or conversion value can raise actual ROAS, while better unit economics can lower the break-even floor. The strongest business outcome can come from improving both sides of the gap.
Practical Break-Even ROAS Workflow
- Choose the campaign, product group or market whose threshold you need.
- Use net sales and current COGS to calculate gross margin.
- List revenue-linked variable costs not already included in gross margin.
- Calculate contribution margin before advertising.
- Use the Break-Even ROAS Calculator or divide 1 by the contribution-margin decimal.
- Compare the result with actual ROAS measured on the same revenue and attribution basis.
- Add required headroom for fixed overhead, profit, cash-flow risk and measurement uncertainty.
- Set campaign or bidding targets only after checking whether the resulting volume and economics support the business goal.
Keep a dated record of the assumptions behind the threshold. A number such as 2.86x is not self-explanatory unless you can trace it back to the margin and variable-cost assumptions that produced it.
When to Recalculate Break-Even ROAS
Recalculate whenever the economics behind contribution margin change materially. Common triggers include supplier price changes, new shipping rates, price increases, discount campaigns, marketplace-fee changes, payment-processing changes, rising refunds, product-mix shifts or entering a new country with different fulfillment economics.
A monthly or quarterly review can work for stable businesses, while fast-changing ecommerce offers may need more frequent updates. The correct frequency depends on how quickly the underlying cost structure moves, not on a fixed industry rule.
Frequently Asked Questions
Sources and Methodology
SolveIndex reviewed current first-party Google Ads documentation for Target ROAS and conversion value, plus Google Ads guidance on ROI. Google describes Target ROAS as an average conversion-value-per-cost goal and gives 500% as the equivalent of $5 conversion value for every $1 of ad spend. Google also explains that conversion values are advertiser-defined inputs used for value-based optimization and that ROI requires business cost context.
For margin terminology, SolveIndex referenced Shopify's current gross-margin guidance, which distinguishes gross margin after COGS from contribution margin after additional variable costs. The break-even ROAS equation on this page is a transparent planning model derived from contribution economics; it is not presented as an official Google Ads metric or a universal industry benchmark.
Primary references: Google Ads Target ROAS bidding, Google Ads conversion values, Google Ads ROI, and Shopify gross margin and contribution-margin context.
Reviewed on September 5, 2026. Recalculate the threshold with current accounting and fulfillment data before using it for material budget or bidding decisions.
Use the Break-Even ROAS Calculator
Enter gross margin and any additional non-ad variable cost rate to calculate contribution margin, the break-even ROAS multiple, the percentage equivalent and the maximum ad cost supported per $100 of revenue.
Calculate Break-Even ROAS