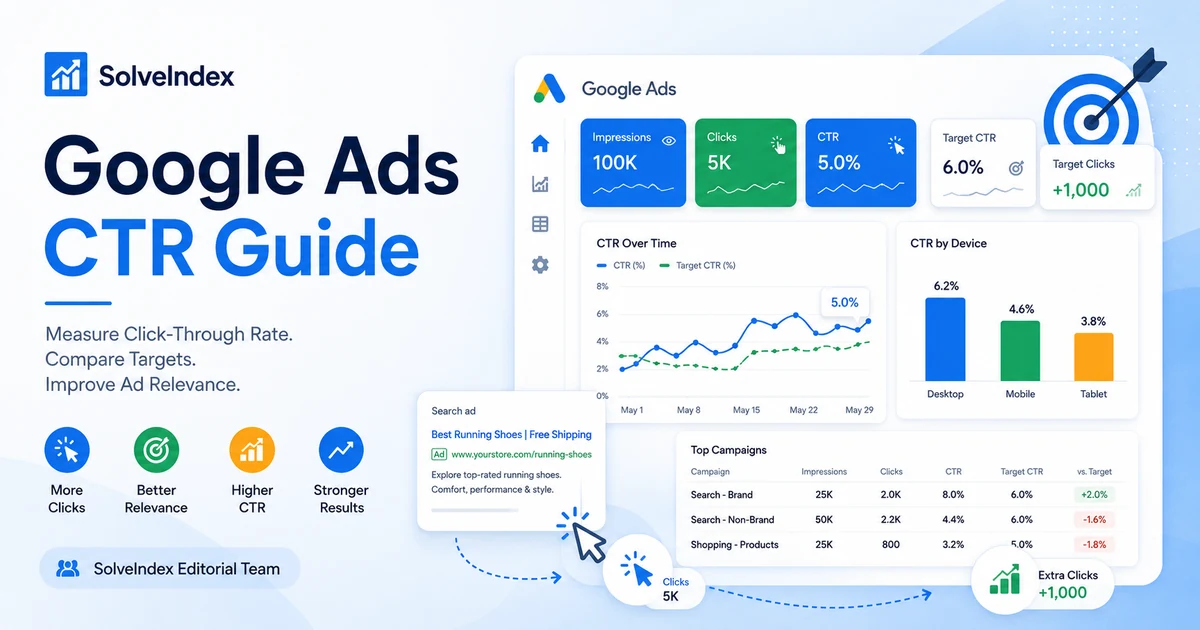
Google Ads click-through rate connects ad exposure with traffic. It tells you what percentage of recorded impressions became clicks, so it can help diagnose whether an ad and its targeting are earning attention. The calculation is simple, but the interpretation is not. Search intent, network, brand demand, match type, device, geography, ad format, auction context and the quality of the offer can all change the CTR you should expect from a campaign.
That is why a useful CTR review starts with a comparable reporting scope and then checks what happened after the click. A stronger click-through rate can be valuable when it brings more qualified traffic, but it can be harmful if a more aggressive message attracts clicks that do not convert. The matching Google Ads CTR Calculator handles the arithmetic and target-click scenario while this guide explains the measurement choices behind the result.
What Is Google Ads CTR?
Google defines click-through rate, or CTR, as the number of clicks an ad receives divided by the number of times the ad is shown. In practical terms, CTR answers a narrow question: when an eligible ad appearance was recorded as an impression, how often did someone click? A campaign with 5,000 clicks from 100,000 impressions has a 5% CTR.
CTR is a traffic-acquisition metric, not a conversion or profitability metric. It does not tell you whether a click became a lead, sale or qualified customer. It also does not include the cost of that click. For that reason, CTR should normally be reviewed beside conversion rate, CPC, CPA, ROAS or ROI rather than used as a standalone business score.
The same distinction protects keyword ownership across SolveIndex. Google Ads CTR measures paid-ad impressions to paid-ad clicks. The separate Organic CTR Calculator measures organic Search visibility to organic clicks. Similar arithmetic does not make those search intents interchangeable because the reporting systems, auction context and optimization decisions are different.
Google Ads CTR Formula
The click-through rate formula uses clicks as the numerator and impressions as the denominator. Multiplying by 100 converts the ratio into a percentage. The SolveIndex calculator also shows clicks per 1,000 impressions and can apply an optional target CTR to the same impression count.
The historical CTR formula describes observed data. The target-click formulas describe a scenario. They do not predict how the auction will respond, how many impressions will remain available, or what the additional clicks will cost. Treat that distinction as part of the formula, not as a small disclaimer added afterward.
How Google Ads Counts Clicks and Impressions
A click is recorded when someone clicks the ad. Google notes that a click can be counted even if the visitor does not ultimately reach the landing page, such as when the page fails to load or the person leaves before loading completes. That is one reason Google Ads clicks and website analytics sessions do not always match perfectly.
Reporting can also be temporarily out of sync. Google documents cases where account reports may briefly show more clicks than impressions, or a CTR above 100%, because click and impression data update at different times. Multiple legitimate clicks from a cached search-results session can also contribute. A persistent anomaly should be investigated, but a short-lived reporting mismatch is not a reason to redesign the CTR formula.
Keep Reporting Scope Consistent
The numerator and denominator need the same scope. If clicks come from one campaign while impressions come from the entire account, the result is mathematically valid but analytically meaningless. Keep campaign, ad group, keyword, network, device, geography and date filters aligned before you calculate or compare CTR.
The same rule matters in period comparisons. A campaign can show a different overall CTR simply because the traffic mix changed. More branded searches, a new match type, a different device mix or a change in Search partner exposure can move the aggregate percentage even if the underlying ads did not become more or less compelling. Segment before assigning a cause.
Google Ads CTR vs Expected CTR
Historical CTR and expected CTR are related but not identical. Historical CTR is the observed ratio of clicks to impressions in the selected report. Expected CTR is Google's diagnostic estimate of how likely an ad is to be clicked when shown. It is used as one component in ad-quality evaluation rather than as a replacement for your actual reporting metric.
This distinction matters when a marketer sees a 5% historical CTR and an "Average" expected CTR status. Those two outputs use different frames of reference. Google compares Quality Score components with other advertisers whose ads showed for the same search over a recent comparison window. Your historical CTR, by contrast, is simply what happened in your chosen data range and filters.
CTR and Quality Score
Quality Score is a diagnostic tool built from expected CTR, ad relevance and landing page experience. Google explicitly says the 1-to-10 Quality Score itself is not a key performance indicator and is not an input in the ad auction. That is useful context because it prevents a common shortcut: assuming that raising raw CTR automatically guarantees a better Quality Score or a better business result.
Use the diagnostic components to investigate a weak area. If expected CTR is below average, Google recommends looking at whether the ad text is compelling and whether it matches keyword intent. If ad relevance or landing page experience is weak, increasing curiosity in the ad without fixing the message-to-page match can create more clicks while leaving the underlying quality problem unresolved.
Search vs Display and Other Networks
A CTR percentage should not be moved from one advertising environment to another as if the user behavior were identical. Search users are actively expressing intent through a query. Display audiences can encounter ads while reading, watching or browsing. Shopping and video formats also create different interaction patterns. Google itself states that a good CTR is relative to what you advertise and the networks on which you advertise.
For analysis, compare Search with Search and Display with Display before looking at a blended account total. If a campaign uses several networks or formats, segment the report first. A blended CTR can hide a strong Search segment and a lower-interaction awareness segment without either being inherently "good" or "bad."
Brand vs Non-Brand CTR
Brand and non-brand campaigns often deserve separate CTR baselines. A person searching a company or product name may already have strong navigational intent and recognize the advertiser. A non-brand query can expose the same advertiser to someone comparing several alternatives for the first time. Combining the two can make an account-level CTR rise simply because branded demand increased.
Keep brand share visible when comparing periods. If a non-brand optimization test appears to improve overall CTR, confirm that the improvement remains after branded queries are separated. Otherwise, the account average may be crediting the test for a demand-mix change it did not cause.
Match Type and Search Intent
Match type and search-term mix influence who sees an ad. A broader set of eligible searches can increase impression volume while introducing more varied intent. A tighter set can reduce volume while improving the alignment between query, ad and offer. Neither outcome should be judged by CTR alone because the commercial value of the traffic can change at the same time.
Review actual search terms and group them by intent before deciding that a low CTR is an ad-copy problem. Sometimes the ad is doing exactly what it should by not attracting weak-fit searches. In other cases, a high volume of irrelevant impressions shows that targeting, negatives or campaign structure need attention before the headline is rewritten.
Device, Geography and Time Differences
Device, location and time can change both the auction and the user's willingness to click. A mobile searcher may see a different amount of visible information than a desktop searcher. Geographic differences can change brand familiarity, competition and offer fit. Daypart and seasonality can change urgency. These dimensions should be segmented when they are large enough to influence decisions.
Do not create a separate target for every tiny segment with too little data. The goal is not maximum segmentation; it is comparable segmentation. Choose dimensions that plausibly change intent or auction context and that have enough volume to support a stable interpretation.
What Is a Good CTR for Google Ads?
There is no single Google Ads CTR benchmark that can responsibly classify every campaign. This is also the most important answer to the common search question "what is a good CTR for Google Ads?" Google states that a good CTR is relative to what you advertise and the network where the ad runs. Brand versus non-brand intent, ad format, device, geography and campaign objective add more context.
External industry averages can still be useful as orientation, but they should not become a universal pass or fail line. A lead-generation advertiser with high-value, narrow-intent queries may prefer fewer highly qualified clicks. A retail advertiser can have a different click and conversion pattern. An awareness campaign can be optimized for a different stage of the funnel than a bottom-of-funnel Search campaign.
Your strongest benchmark is usually a comparable internal segment: the same network, similar search intent, similar brand status, similar geography and enough recent data to reduce noise. Then examine whether a higher or lower CTR improved the downstream metric that actually matters, such as qualified leads, sales, CPA, ROAS or profit.
Build a Better CTR Benchmark
A practical benchmark starts with a baseline and a decision. Instead of asking whether 5% is universally good, ask whether 5% is above or below the recent comparable baseline for this Search non-brand segment and whether the difference is accompanied by acceptable CPC, conversion rate and CPA. That produces an answer tied to the account rather than to an unrelated average.
| Benchmark layer | Best use | Main caution |
|---|---|---|
| Same campaign over time | Track changes after controlled edits | Query mix and auction conditions can still change |
| Comparable internal segments | Compare similar brand, network and intent groups | Keep date and reporting definitions aligned |
| External industry research | Provide broad market context | Samples may differ in industry, network, country or objective |
| Entered target CTR | Run a planning scenario | A target is not a forecast of future auction performance |
Worked Google Ads CTR Example
Suppose a Google Ads segment records 100,000 impressions and 5,000 clicks during one reporting period. Divide 5,000 by 100,000 to get 0.05, then multiply by 100. The historical Google Ads CTR is 5%. The same data also equals 50 clicks per 1,000 impressions.
| Measure | Value | Meaning |
|---|---|---|
| Impressions | 100,000 | Recorded ad appearances in the selected scope |
| Clicks | 5,000 | Recorded clicks in the same scope |
| Current CTR | 5.00% | 5,000 / 100,000 x 100 |
| Clicks per 1,000 impressions | 50 | Equivalent frequency view of the same CTR |
| Scenario target CTR | 6.00% | User-selected comparison target |
That historical result does not say whether 5% is good for every advertiser. It says exactly what happened in this reporting scope. The next step is to compare the segment with its own relevant history and check the traffic economics after the click.
Target Clicks and Relative CTR Uplift
If the same 100,000 impressions are held constant and a 6% target CTR is entered, the scenario requires 6,000 clicks. That is 1,000 incremental clicks compared with the current 5,000. Moving from 5% to 6% is a 1 percentage-point increase but a 20% relative uplift because 1 percentage point is 20% of the starting 5%.
Keep percentage points and relative percent change separate when reporting. Also remember that the target scenario does not forecast 6,000 future clicks. Bids, Ad Rank, competition, available demand and impression share can change while CTR changes, so the constant-impression assumption is a sensitivity test rather than an auction model.
How to Interpret a High CTR
A high CTR can be evidence that the ad, keyword and user intent are well aligned. Google describes high CTR as a good indication that users find ads helpful and relevant. Within a comparable segment, a sustained CTR increase after a controlled copy or targeting change can therefore be a useful positive signal.
Do not stop at the click. Check conversion rate, CPA, conversion value and search-term quality. An ad can earn more clicks by making a broader promise or using an aggressive call to action, but if the landing page or offer cannot fulfill that promise, downstream performance may deteriorate. High CTR is strongest when it is paired with relevant traffic and acceptable economics.
How to Interpret a Low CTR
A low CTR can point to weak ad relevance, an uncompetitive offer, broad targeting, poor search-term fit or a different campaign objective. It can also be normal for a network or audience with lower immediate click intent. Before changing copy, identify where the low CTR occurs and whether the segment is actually expected to generate direct clicks at the same rate as the comparison group.
If the issue is concentrated in Search and the expected CTR component is below average, inspect query-to-ad alignment and the strength of the offer. If the issue appears only after broadening eligibility, inspect the search terms and negatives. If CTR is lower but conversion quality and profit are better, the lower rate may be an acceptable tradeoff rather than a problem to eliminate.
When CTR and Conversions Disagree
CTR and conversion rate measure different stages. CTR asks whether an impression became a click. Conversion rate asks whether traffic completed a defined outcome. A campaign can improve CTR while conversion rate falls if the additional clicks come from broader or less-qualified intent. It can also show a lower CTR but a stronger conversion rate if the targeting filters out casual clickers.
Use a simple funnel to diagnose disagreement: impressions to clicks to conversions to value. Then add cost. The metric that changes first helps locate the issue. If CTR improves but conversions do not, inspect search terms, landing-page message match, conversion tracking and the quality of the incremental traffic before declaring the CTR optimization successful.
CTR vs CPC
CTR measures click frequency; CPC measures the average cost of clicks. They can move in different directions because Google Ads is an auction and actual CPC depends on auction conditions, bids, quality and competition. A higher CTR does not mathematically guarantee a lower CPC, and a lower CPC does not guarantee better traffic.
Use the CPC Calculator when the question changes from "how often did people click?" to "what did each click cost on average?" Reviewing CTR and CPC together is useful because a target-click scenario has a budget implication. If 1,000 additional clicks are desired, the expected CPC helps estimate the approximate additional spend before conversion outcomes are considered.
CTR vs Conversion Rate and CPA
Conversion rate connects clicks with outcomes, while CPA connects spend with acquired actions or customers. These metrics answer questions that CTR cannot. A 6% CTR can be attractive if the clicks convert efficiently, but the same 6% can be expensive if CPC rises and conversion quality falls.
The CPA Calculator is a better next step when the business decision concerns the cost of conversions. When evaluating a CTR experiment, compare the before-and-after CPA using the same conversion definition and attribution settings. Otherwise, a reporting change can look like a performance change.
CTR vs ROAS and ROI
ROAS and ROI sit further down the economic chain. ROAS compares attributed conversion value with advertising spend. ROI requires a broader view of profit and investment. Neither can be inferred from CTR. More clicks can increase revenue, reduce efficiency, or do both depending on price, margin, conversion rate and cost.
Use the ROAS Calculator for ad-spend efficiency and the Google Ads ROI Calculator for a higher-level financial view. CTR is most useful as an upstream diagnostic that helps explain how the traffic part of those financial metrics is changing.
How to Improve Google Ads CTR
Improving Google Ads CTR should mean earning more appropriate clicks from eligible impressions, not simply maximizing the click count. Start with the segment where the issue is visible, identify the user intent, and change the smallest number of variables necessary to learn something. A focused test is easier to interpret than changing ads, keywords, bids, landing pages and targeting at the same time.
Google's own Quality Score guidance emphasizes relevance: match ad language to user search terms, keep keyword groups coherent, make the offer compelling, connect calls to action with the landing page and use Quality Score components as diagnostics. These practices improve the chance that a click represents real alignment instead of curiosity alone.
Improve Ad and Keyword Relevance
Read the search terms that generated impressions and ask whether one ad can credibly answer all of them. If a group contains materially different intents, split the structure so the message can be more specific. Use the language of the user's problem where it accurately describes the offer. The goal is not mechanical keyword repetition; it is a clear reason for the right searcher to click.
Relevance also includes exclusion. Negative keywords and better targeting can reduce impressions from searches that are unlikely to convert. That can change CTR by changing the denominator and the audience mix. Document those changes so you do not attribute an improvement solely to ad copy when targeting also changed.
Improve Offers and Calls to Action
A strong ad makes the offer understandable before the click. Clarify a genuine benefit, price signal, eligibility condition or differentiator where appropriate. Calls to action should match the next step on the landing page. If the ad says "Get a quote," the destination should make that quote process obvious rather than forcing the visitor to search for it.
Avoid promises designed only to inflate CTR. Clickbait can create a temporary increase while lowering conversion rate and trust. A useful ad filters as well as attracts: it gives qualified users a reason to click and gives poor-fit users enough information to avoid an unnecessary click.
Review Search Terms and Segmentation
Segmenting search terms often reveals that a single campaign-level CTR is hiding several different stories. One intent cluster may have strong relevance and conversion quality while another produces many impressions and few useful clicks. Separate brand, non-brand and major intent groups before deciding what to optimize.
Use device, geography and network segments when they are material to the decision. Keep the date range long enough to reduce random volatility but recent enough to reflect the current offer and campaign structure. When volume is small, avoid overreacting to a few clicks or missed impressions.
Avoid CTR-Only Optimization
CTR is easy to see and easy to optimize toward, which makes it tempting to treat the metric as the objective. Google advises using Quality Score with other account metrics, and the same principle applies to CTR. Define the downstream guardrails before you run the test: conversion rate, CPA, qualified-lead rate, revenue, ROAS or another outcome that reflects the campaign's purpose.
If CTR improves while the guardrail worsens materially, investigate before scaling the change. If CTR stays flat while CPA improves, the experiment may still be a success. The goal is better advertising performance, not the highest possible ratio of clicks to impressions.
Common Google Ads CTR Mistakes
- Comparing Search, Display, Shopping or video CTR as if the networks have the same user behavior.
- Mixing clicks and impressions from different date ranges, campaign filters or reporting scopes.
- Using a universal market average as a pass or fail threshold for every account.
- Combining brand and non-brand traffic without checking how the mix changed.
- Treating historical CTR and Google's expected CTR diagnostic as the same metric.
- Assuming a higher CTR automatically creates a higher Quality Score, lower CPC or better Ad Rank.
- Optimizing ad copy for curiosity while ignoring landing-page message match and conversion quality.
- Calling a constant-impression target-click scenario a forecast of future traffic.
- Ignoring search-term, device, geography or match-type changes that altered the impression mix.
- Judging a CTR experiment without checking conversion rate, CPA, ROAS or another business guardrail.
Practical CTR Review Checklist
- Choose one campaign, ad group, keyword or other clearly defined reporting scope.
- Use clicks and impressions from the same filters and date range.
- Calculate current CTR and, if useful, clicks per 1,000 impressions.
- Separate major network, brand and intent differences before benchmarking.
- Compare with a recent internal baseline that uses similar conditions.
- Check expected CTR, ad relevance and landing page experience when Search quality diagnostics are relevant.
- Review search terms to see whether low or high CTR is being driven by a change in query mix.
- Define a target CTR only as a scenario unless a separate forecasting model supports future impressions.
- Check CPC, conversion rate, CPA and value metrics before deciding whether a CTR change is desirable.
- Record material bidding, targeting, creative, landing-page and tracking changes before comparing periods.
Re-run the calculation after enough new data accumulates. The objective is not to force every segment toward one benchmark; it is to understand whether a change in click behavior represents better relevance and better business performance for that specific campaign context.
Google Ads CTR Frequently Asked Questions
Sources and Methodology
SolveIndex reviewed current first-party Google Ads documentation for the metric definition and platform behavior used in this guide: Google Ads CTR definition, Google Ads click definition, Quality Score for Search campaigns, Quality Score improvement guidance, reporting discrepancies, and Google Ads ad quality guidance.
The historical CTR calculation is arithmetic based on the clicks and impressions supplied by the user. The target-click and relative-uplift outputs are scenarios that hold impressions constant. They are not auction forecasts, budget recommendations or guarantees of additional conversions. Benchmark discussion is framed as comparative context because Google Ads performance varies by network, intent, campaign structure, geography, device and business model. Reviewed September 2, 2026.
Use the Google Ads CTR Calculator
Calculate Google Ads click-through rate from your own clicks and impressions, then test a target-click scenario without treating that scenario as a forecast.
Open the Google Ads CTR Calculator