SaaS LTV:CAC connects customer retention and gross profit with the complete cost of acquiring new paying customers. It helps founders, finance teams, growth leaders and investors test whether acquisition can create enough lifetime value and whether cash is recovered quickly enough to support growth.
This guide explains the simple LTV formula, fully loaded CAC, gross margin, customer churn, CAC payback, target CAC and the limitations that make cohort analysis necessary for larger decisions.
What the SaaS LTV:CAC Calculator Measures
The SolveIndex SaaS LTV:CAC calculator is a unit-economics screening tool for subscription businesses. It connects the average recurring revenue generated by one paying account with gross margin, customer churn and the fully loaded cost of acquiring new customers. The main outputs are CAC, estimated customer lifetime, revenue LTV, gross-margin-adjusted LTV, LTV:CAC ratio, CAC payback, lifetime gross profit after CAC and a maximum CAC based on a chosen target ratio.
The calculator is not the same as the buyer-side SaaS ROI calculator. SaaS ROI asks whether purchasing a software subscription creates enough value for the buyer. LTV:CAC asks whether a SaaS company earns enough gross profit from a customer to justify the cost of acquiring that customer. Keeping those intents separate prevents revenue, software cost and customer-acquisition metrics from being mixed into one misleading percentage.
Core SaaS LTV, CAC and Payback Formulas
Use one customer segment and one consistent measurement period. Monthly ARPA, monthly customer churn and monthly gross margin should describe the same customer population. Acquisition spending and new paying customers should cover the same month, quarter or year.
Percentages must be converted to decimals inside the formula. A 4% monthly churn rate is 0.04 and an 80% gross margin is 0.80.
Worked SaaS LTV:CAC and Payback Example
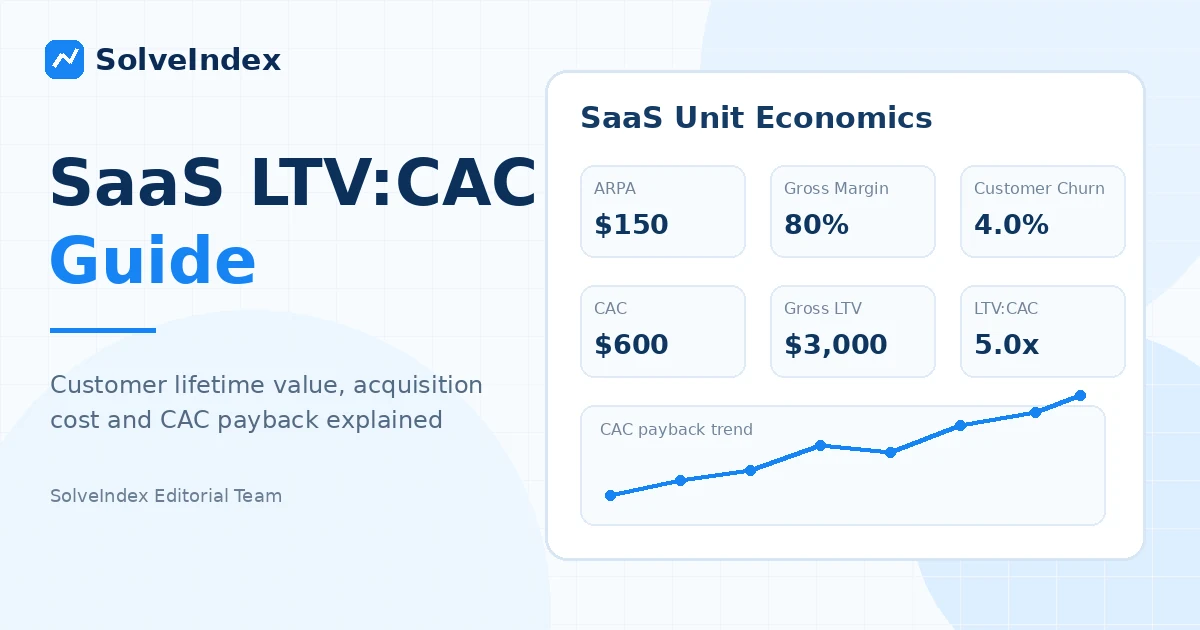
Assume a B2B SaaS segment produces $150 of monthly ARPA at an 80% gross margin. Monthly customer churn is 4%. During one quarter, the company spends $15,000 on marketing, $10,000 on sales and $5,000 on other acquisition activity and acquires 50 new paying customers.
Total acquisition spend is $30,000. CAC is $30,000 divided by 50, or $600. Estimated customer lifetime is one divided by 0.04, or 25 months. Revenue LTV is $150 divided by 0.04, or $3,750. Gross-margin-adjusted LTV is $3,750 multiplied by 80%, or $3,000. The LTV:CAC ratio is $3,000 divided by $600, or 5.0x. Monthly gross profit per account is $120, so CAC payback is $600 divided by $120, or 5 months. Estimated lifetime gross profit after CAC is $2,400.
The arithmetic is useful, but it is still a simplified forecast. A newer customer cohort may churn differently from mature customers. Enterprise accounts may have higher acquisition cost and lower churn than self-serve accounts. Report the assumptions with the result so the ratio can be reproduced and challenged.
| Input or result | Calculation | Amount |
|---|---|---|
| Total acquisition spend | $15,000 + $10,000 + $5,000 | $30,000 |
| CAC | $30,000 / 50 | $600 |
| Customer lifetime | 1 / 4% | 25 months |
| Revenue LTV | $150 / 4% | $3,750 |
| Gross-margin LTV | $3,750 x 80% | $3,000 |
| LTV:CAC | $3,000 / $600 | 5.0x |
| CAC payback | $600 / ($150 x 80%) | 5 months |
Align Acquisition Costs and New Customers
CAC becomes unreliable when the numerator and denominator use different periods. A quarterly cost total should be divided by customers acquired during that same quarter. Do not divide a full year of sales and marketing expense by one month of new customers or use current-quarter customers with prior-year spending without a deliberate lag model.
Some sales cycles create timing delays. Enterprise sales expense incurred this quarter may generate customers next quarter. In that case, choose a documented attribution method, such as matching acquisition expense to the cohort it produced or using a trailing multi-month average. Consistency matters more than selecting the most flattering period.
Count new paying customers, not leads, trials, free users or opportunities. A campaign-level cost per acquisition can be narrower than fully loaded company CAC. Label each metric clearly so media-only CPA is not compared with CAC that includes salaries, commissions, tools and agencies.
Calculate Fully Loaded Customer Acquisition Cost
A practical SaaS CAC model can include paid media, content production, sponsorships, events, webinars, agencies, contractors, sales and marketing salaries, commissions, prospecting tools, CRM and marketing automation software and other spending directly related to winning new customers.
Exclude product research, general administration, infrastructure and ongoing customer support unless a documented portion is specifically acquisition-related. Avoid double counting shared software or employee expense in multiple fields. When allocating salaries or tools across acquisition and retention work, use a stable allocation rule and record it.
Blended CAC is useful for company-level planning, but channel and segment CAC often reveal the actionable story. Paid search, outbound sales, partnerships, organic search and referrals can have very different costs, sales cycles and customer quality. Calculate separate CAC values when sufficient data exists.
Measure ARPA and Monthly Customer Churn Consistently
Average revenue per account is usually recurring revenue divided by active paying accounts for the same interval. Use account-level ARPA when the churn input is account-level customer churn. Mixing per-user revenue with per-account churn can create a unit mismatch.
Monthly customer churn is customers lost during the month divided by customers at the start of the month. Use the same customer definition in both numbers. Decide how to treat pauses, failed payments, downgrades, migrations and reactivations before calculating the rate.
The simple lifetime estimate uses one divided by customer churn. This is a convenient planning approximation, not a literal promise that every account remains for exactly that number of months. When churn is very low, small data errors can create very large changes in estimated lifetime and LTV.
Use Gross-Margin-Adjusted LTV
Revenue LTV measures expected lifetime revenue, but it does not reflect the direct cost of delivering the service. Gross-margin-adjusted LTV is more useful for acquisition planning because it estimates lifetime gross profit before acquisition cost and operating expenses.
SaaS cost of revenue can include hosting and infrastructure that scale with delivery, customer support, third-party services, payment processing and applicable professional-service delivery costs. Accounting treatment varies, so use the gross margin reported consistently by the business rather than importing an unrelated industry benchmark.
A company with $4,000 of revenue LTV and 80% gross margin has $3,200 of gross-margin-adjusted LTV. If CAC is $1,000, the revenue-based ratio is 4.0x but the gross-profit-based ratio is 3.2x. The second result provides a more conservative view of acquisition efficiency.
Customer Churn and Revenue Churn Are Different
Customer churn measures lost accounts. Revenue churn measures recurring revenue lost from cancellations and sometimes downgrades. Net revenue churn can also incorporate expansion revenue. These metrics answer different questions.
The calculator uses customer churn because ARPA is expressed per account and estimated lifetime is based on account survival. Substituting net revenue churn can produce unstable or impossible results when expansion offsets lost revenue. A business with negative net revenue churn still has customers leaving, so its average customer lifetime is not infinite.
Use revenue retention metrics alongside LTV:CAC to understand expansion and contraction, but keep the simple account-based formula internally consistent.
Understand the Limitations of Simple SaaS LTV
The simple LTV formula assumes stable ARPA, gross margin and churn over time. Real customer cohorts rarely behave so evenly. Churn may be high during onboarding, improve after product adoption and rise again at renewal. Expansion, contraction, annual prepayments, discounts and price changes can alter revenue while accounts remain active.
The formula can overstate value when early churn is concentrated, when a small sample produces an unusually low churn rate or when recent price increases have not been tested through renewal. It can understate value when successful customers expand materially over time.
For major budgeting or valuation decisions, compare the simple estimate with cohort retention curves, realized gross profit, survival analysis and segment-level data. The calculator is strongest as a consistent first-pass model and a way to test assumptions.
How to Interpret the LTV:CAC Ratio
A ratio below 1.0x means estimated lifetime gross profit is lower than acquisition cost under the entered assumptions. Between 1.0x and 2.0x may indicate thin unit economics after overhead and risk. Around 3.0x is a common reference point for SaaS planning, while a materially higher ratio can indicate strong efficiency or possible underinvestment in growth.
No ratio should be judged without payback, cash flow and data quality. A 4.0x ratio with a 30-month payback can be harder to finance than a 3.0x ratio with a 7-month payback. A high ratio based on one month of unusually low churn is less dependable than a lower ratio supported by several mature cohorts.
Use the ratio as a comparison tool across time, channels and customer segments. Do not present it as a guaranteed valuation multiple or a complete measure of company profitability.
Calculate and Interpret CAC Payback Period
CAC payback estimates how many months of gross profit from a new customer are required to recover acquisition cost. Divide CAC by monthly ARPA multiplied by gross margin. The formula assumes stable monthly gross profit and does not model billing timing, annual prepayment, onboarding fees or expansion.
Shorter payback generally improves cash recycling because acquisition spending is recovered sooner. Longer payback can still be acceptable for durable enterprise contracts, but it increases financing needs and exposure to churn before recovery.
Compare payback with contract length, renewal timing and customer survival. If estimated lifetime is shorter than CAC payback, the model is internally unattractive because the average customer is expected to leave before acquisition cost is recovered.
Estimate Maximum CAC at a Target Ratio
The maximum CAC output divides gross-margin-adjusted LTV by the target ratio. If LTV is $3,000 and the target is 3.0x, maximum CAC is $1,000. This is a planning ceiling under the current assumptions, not permission to spend that amount in every channel.
A company may choose a stricter target when cash is limited, churn is volatile or the LTV estimate is immature. It may accept a lower ratio for a strategic segment with faster payback, strong expansion, lower servicing risk or defensible cross-sell value.
Recalculate the ceiling when pricing, margin, churn or channel mix changes. A target CAC based on outdated retention can encourage overspending.
Segment LTV:CAC by Customer Type and Channel
Blended averages can hide profitable and unprofitable groups. Calculate separate unit economics for self-serve, small business, mid-market and enterprise customers when ARPA, churn, sales effort or support cost differs. Channel-level views can compare paid search, organic search, outbound, affiliates, partnerships and referrals.
Use enough data to avoid overreacting to tiny samples. A channel that acquired three customers may show a dramatic ratio that disappears as the cohort matures. Report cohort size, measurement period and customer age beside the result.
Internal links between the SolveIndex Marketing ROI, Google Ads ROI and SEO ROI calculators can help evaluate campaign-level revenue and profit. The LTV:CAC calculator then adds the longer-term customer and fully loaded acquisition perspective.
Ways to Improve SaaS LTV:CAC and Payback
LTV can improve through better onboarding, product adoption, customer success, pricing, packaging, expansion and reduced involuntary churn. Gross margin can improve through infrastructure efficiency, support automation, pricing discipline and better alignment between service cost and plan design.
CAC can improve through better targeting, stronger conversion, faster sales cycles, referral loops, organic acquisition, channel mix and clearer qualification. Payback improves when CAC falls, monthly ARPA rises or gross margin increases.
Avoid improving the reported ratio only through accounting changes. Excluding real acquisition costs, using revenue instead of gross profit or selecting an unusually low churn month makes the metric look better without improving the business.
Common SaaS LTV:CAC Calculation Mistakes
Common errors include mixing monthly and annual rates, using revenue churn in an account-lifetime formula, dividing acquisition spending by leads instead of paying customers, excluding sales salaries and commissions, comparing costs and customers from different periods, using revenue LTV without gross margin and applying one blended ratio to every segment.
Other mistakes include treating free users as acquired customers, counting expansion from existing customers as new acquisition, using a recent low-churn cohort before it matures, assuming a 3.0x ratio guarantees profitability and ignoring payback and cash timing.
Document every definition. A repeatable method with conservative assumptions is more useful than a precise-looking number that cannot be reconciled to finance and billing data.
SaaS LTV:CAC Review Checklist
Before using the output for a growth decision, confirm that ARPA, gross margin and customer churn describe the same segment and interval. Confirm that acquisition spending and new paying customers use aligned periods and that shared costs follow a documented allocation method.
Review cohort retention, contract mix, expansion, discounts, refunds and failed payments. Compare blended and segment-level results. Check whether CAC payback occurs before typical customer churn and whether the company has enough cash to fund the payback window.
Finally, save the assumptions and recalculate regularly. LTV:CAC is most useful as a trend and decision system, not a one-time dashboard decoration.
SaaS LTV:CAC Frequently Asked Questions
Sources and Methodology
The calculator uses the commonly accepted simple SaaS LTV model based on ARPA, gross margin and customer churn, together with fully loaded CAC and gross-profit payback formulas. Stripe guidance supports aligned sales and marketing costs, new paying customer counts, gross margin and LTV:CAC interpretation. ChartMogul documents the simple ARPA and churn LTV method and its limitations. Paddle provides supporting CAC payback context.
The model intentionally excludes advanced discounting, cohort survival, expansion and contraction so users can reproduce the result from a small set of clearly labeled inputs. Use official finance, billing and customer data where possible and retain the assumptions with each saved calculation.
Official Reference Links
Stripe CAC in SaaS guidance, Stripe SaaS metrics guide, Stripe SaaS gross margin guidance, ChartMogul customer lifetime value methodology, and Paddle payback-period guidance. These sources support definitions and methodology; they do not guarantee a specific ratio, payback or business outcome.