Net revenue retention shows whether an existing customer base is shrinking, holding steady or expanding in recurring-revenue terms. It is one of the most useful SaaS retention metrics because it combines churn, downgrades and expansion while deliberately excluding new business.
The calculation is simple. The hard part is defining the cohort and revenue movements consistently. This guide uses a repeatable SaaS framework and explains where NRR differs from GRR, customer churn, MRR growth and ARR.
What Is NRR and Net Dollar Retention?
NRR stands for net revenue retention. It measures the percentage of recurring revenue retained from customers that already existed at the start of a period after accounting for full churn, contraction and expansion. Net dollar retention, or NDR, is commonly used as another name for the same concept in SaaS and investor reporting.
If an opening cohort contributes $100,000 of MRR and those same customers contribute $101,000 at the end of the period after all losses and expansion, NRR is 101%. The metric says the installed base grew by 1% without using any revenue from new customers.
NRR can be measured monthly, quarterly or annually, but longer cohort windows are often more useful for understanding renewal and expansion behavior. ChartMogul commonly benchmarks retention over 12 months because that window captures more of the customer lifecycle and reduces short-term seasonality.
NRR Formula and Net Revenue Retention Calculation
The standard formula starts with recurring revenue from the existing customer cohort. Subtract recurring revenue lost to churn and contraction, add recurring expansion from the same cohort, then divide by beginning recurring revenue.
Use MRR with MRR movements or ARR with ARR movements. Do not use opening ARR and then subtract one month of churned MRR. The units and period must match. The same rule applies to currencies and customer segments.
Worked NRR Calculation Example
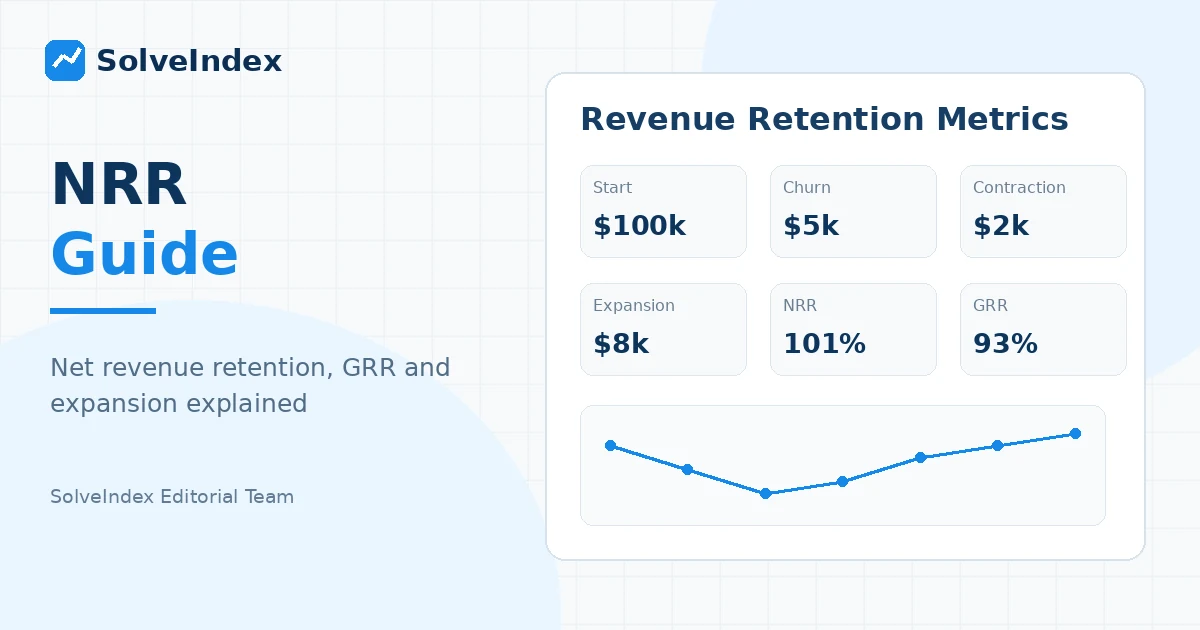
Assume a B2B SaaS company begins the month with $100,000 of MRR from existing customers. During the month, customers that fully leave remove $5,000 of MRR. Downgrades and lower recurring usage remove another $2,000. Existing customers add $8,000 through upgrades, extra seats and cross-sells.
Ending existing-customer MRR is $101,000. NRR is $101,000 divided by $100,000, or 101%. GRR is 93% because the $8,000 expansion is excluded from the gross retention calculation. Net revenue churn is negative 1%, while gross revenue churn is 7%.
| Input or result | Calculation | Value |
|---|---|---|
| Beginning MRR | Opening cohort | $100,000 |
| Churned MRR | Full cancellations | $5,000 |
| Contraction MRR | Downgrades | $2,000 |
| Expansion MRR | Upsells and growth | $8,000 |
| Ending cohort MRR | $100,000 - $5,000 - $2,000 + $8,000 | $101,000 |
| NRR | $101,000 / $100,000 | 101% |
| GRR | ($100,000 - $5,000 - $2,000) / $100,000 | 93% |
Use the Same Existing Customer Cohort
NRR is a cohort metric. The denominator and every movement in the numerator must describe customers that existed at the start of the period. If you begin with customers active on January 1, the ending revenue should come from those same customers, including any upgrades or downgrades they make before the measurement date.
This cohort rule makes NRR different from total recurring-revenue growth. It isolates what happened to the installed base instead of mixing retention with acquisition.
Why New Customer Revenue Is Excluded
New customer revenue should not be added to NRR because those customers were not part of the opening cohort. Adding new MRR can make weak retention look healthy. A company could lose substantial revenue from existing customers, acquire enough new business to replace it, and still report strong total MRR growth.
Use the MRR Calculator when you want total recurring-revenue movement including new business. Use NRR when you want to know whether the existing customer base is retaining and expanding revenue.
Churned Revenue
Churned revenue is recurring revenue lost when an existing customer fully leaves under your subscription-status definition. If a $2,000 MRR account cancels, that $2,000 is churned MRR. Keep customer churn separate from revenue churn: one lost account can represent a very different amount of revenue from another.
Contraction Revenue
Contraction is recurring revenue lost when a customer remains active at a lower recurring amount. It can come from seat reductions, plan downgrades, lower committed usage, removing recurring add-ons or other recurring reductions. Contraction matters because NRR can weaken even when no customer fully churns.
Expansion Revenue
Expansion is additional recurring revenue from customers in the opening cohort. Common examples include upgrading plans, adding seats, purchasing recurring modules, increasing committed usage or qualifying price increases. Expansion is what allows NRR to exceed 100%.
Do not count new-customer MRR as expansion. Expansion is growth inside an account that was already part of the cohort.
How to Treat Reactivations
Reactivation treatment varies across systems. Some subscription analytics platforms classify a returning customer as reactivation rather than expansion or new business. For a fixed opening-cohort NRR analysis, document whether the reactivated account belonged to the opening cohort and use one method consistently across periods.
The SolveIndex calculator does not provide a separate reactivation field. If your reporting system tracks reactivation separately, reconcile it before mapping revenue into churn or expansion so the same dollars are not counted twice.
NRR vs GRR
NRR and gross revenue retention answer related but different questions. NRR asks whether the opening revenue base grew or shrank after both losses and expansion. GRR asks how much opening revenue survived losses before expansion is allowed to offset them.
A company can report 110% NRR and still have weak GRR if a concentrated set of customers expands enough to hide churn or downgrades elsewhere. That is why experienced SaaS operators review NRR and GRR together rather than choosing one headline metric.
GRR Formula
Expansion is excluded, so GRR cannot exceed 100% under the standard formula. A 100% GRR means the opening cohort lost no recurring revenue to churn or contraction during the measurement period.
NDR, GDR and Dollar Retention Terminology
NRR is commonly called net dollar retention, or NDR. GRR can similarly be called gross dollar retention, or GDR. The terms emphasize that revenue rather than customer count is being retained. In practice, definitions still vary among companies and public filings, so compare formulas and cohort rules before comparing percentages.
NRR and Net Revenue Churn
Net revenue churn is the inverse expression of NRR when both metrics use the same revenue movements. Net revenue churn equals 100% minus NRR. An NRR of 101% corresponds to net revenue churn of negative 1%.
Gross revenue churn similarly equals 100% minus GRR. The relationship should reconcile exactly if the same opening revenue, churn, contraction and expansion definitions are used.
What NRR Above 100% Means
NRR above 100% means expansion from the existing cohort exceeded churn and contraction. The revenue base grew without relying on newly acquired customers. This is sometimes called negative net revenue churn.
It is a valuable growth signal, but it is not proof that customer churn is low. A few large accounts can expand while many smaller customers leave. Pair NRR with GRR, customer retention and customer concentration.
What NRR Below 100% Means
NRR below 100% means the opening cohort is shrinking in recurring-revenue terms because churn and contraction exceed expansion. That does not automatically mean the whole company is shrinking. Strong new customer acquisition can still drive total MRR or ARR growth, but the installed base is creating a revenue headwind that must be replaced before the business can grow.
What Is a Good NRR for SaaS?
There is no single NRR target that fits every SaaS company. Current Stripe guidance says NRR above 100% generally indicates healthy customer retention and expansion, but also notes that benchmarks vary by industry and business stage. ChartMogul likewise treats 100% as an important SaaS reference while showing substantial variation by ARR, ARPA, billing cadence and subscriber count.
Use 100% as a directional breakpoint, not a universal grade. The better comparison is your own mature cohorts plus businesses with similar customer size, sales motion and billing structure.
Current B2B SaaS Retention Context
ChartMogul's current 2025 retention research analyzed thousands of software companies and reported a median annualized NRR of 82% for B2B SaaS businesses above its minimum ARR threshold, with an upper-quartile B2B NRR of 97%. The same research found much lower retention for B2C and AI-native cohorts. This illustrates why a single SaaS-wide benchmark can be misleading.
Benchmark age also matters. A fast-growing early-stage company can post strong total growth while NRR is still weak, whereas larger businesses increasingly depend on expansion and retention because the installed revenue base becomes a bigger part of future growth.
How Billing Cadence and ARPA Affect NRR
Current ChartMogul billing research shows stronger retention on annual plans than monthly plans across many ARPA bands. Higher-ARPA SaaS businesses are also more likely to approach or exceed 100% NRR because they often have deeper adoption, longer contracts and more expansion opportunities.
Do not apply an enterprise benchmark to a low-ARPA self-serve product. Compare annual-plan cohorts with annual-plan peers and monthly-plan cohorts with businesses that have similar monetization and customer commitment.
Segment NRR by Customer Type
Blended NRR can hide large differences among enterprise, mid-market, small-business and self-serve customers. Segment by customer size, product line, geography, billing cadence, sales motion or acquisition channel when those groups have different retention behavior.
Report opening recurring revenue with each segmented percentage. A 120% NRR from a tiny cohort does not carry the same economic weight as 98% NRR from the majority of company ARR.
Use Cohort NRR Instead of Blended Averages
Cohort NRR tracks customers that share a start date or another meaningful characteristic as they mature. This can reveal whether onboarding improvements, pricing changes or new acquisition sources are producing customers that retain and expand better than earlier cohorts.
A blended company NRR can improve simply because customer mix changes. Cohort analysis helps separate genuine retention improvement from a temporary shift toward customers with naturally higher expansion.
NRR vs MRR and ARR
NRR isolates recurring-revenue movement from existing customers. MRR growth combines that installed-base movement with new business. ARR annualizes or measures the recurring-revenue scale over an annual basis. These metrics are connected but should not be substituted for one another.
A company can have 90% NRR and still grow total MRR rapidly by acquiring many new customers. It can also have 105% NRR but slow total growth if new business is weak. NRR explains the quality of the existing revenue engine; MRR and ARR explain total recurring scale and movement.
NRR vs Customer Churn
Customer churn counts lost accounts. NRR weights accounts by recurring revenue and includes expansion. A company can lose several small customers while large customers expand, producing high NRR despite visible logo churn. Conversely, losing one large customer can damage NRR while customer churn remains numerically low.
Use the SaaS Churn Rate Calculator to compare customer churn with revenue churn and avoid interpreting NRR as a substitute for logo retention.
How NRR Connects with LTV and Unit Economics
Strong revenue retention can support customer lifetime economics because retained accounts continue generating recurring gross profit and expansion can raise revenue per account. However, the simple SolveIndex LTV:CAC model uses customer churn rather than NRR in its lifetime denominator. Do not substitute negative net revenue churn into a customer-lifetime formula.
Use the SaaS LTV:CAC Calculator for customer-level lifetime economics and use NRR to understand expansion and revenue durability inside the installed base.
Ways to Improve Net Revenue Retention
Improving NRR requires protecting recurring revenue while creating legitimate expansion. Better onboarding, product adoption, customer success, renewal workflows and payment recovery can reduce churn. Better packaging, additional seats, usage growth, cross-sells and valuable product modules can increase expansion.
Reduce contraction by identifying why customers downgrade. Sometimes the solution is better product value; in other cases, packaging should give customers a lower-cost path that preserves the relationship instead of forcing full churn.
Track the component that changed. A higher NRR driven by lower churn is different from a higher NRR driven by a broad price increase, and each has different implications for customer health.
Common NRR Calculation Mistakes
Common mistakes include adding new-customer revenue to the numerator, using total company ending MRR instead of revenue from the opening cohort, mixing MRR and ARR, omitting contraction, double counting an upsell, changing the cohort during the period and applying inconsistent currency conversion.
Other problems include treating expansion from a new customer as installed-base expansion, changing the definition of churn between reporting periods, ignoring credits or contract amendments and assuming NRR above 100% means GRR and customer retention are also healthy.
NRR Review Checklist
Before publishing NRR, confirm the opening cohort and recurring-revenue basis. Reconcile churn, contraction and expansion for those same customers. Exclude new business. Calculate GRR alongside NRR and reconcile net and gross revenue churn.
Then segment the result where economics differ materially, compare with mature historical cohorts and use external benchmarks only when the peer group is genuinely comparable. Save the definitions used so future periods measure business change rather than methodology change.
NRR Frequently Asked Questions
Sources and Methodology
SolveIndex uses current SaaS methodology and benchmark sources to cross-check metric definitions. References include Stripe net revenue retention guidance , Stripe gross revenue retention guidance , ChartMogul NRR methodology , ChartMogul benchmarks methodology , ChartMogul 2025 retention research , and ChartMogul billing and retention research . Benchmark figures are comparison context, not guaranteed targets.