SaaS churn rate measures how quickly customers or recurring revenue leave an existing subscription base. It is one of the most important inputs in retention planning because small changes in monthly churn can materially change annual customer survival, recurring revenue, lifetime value and the amount of new business needed to keep growing.
The phrase "churn rate" is often used as if it describes one metric, but SaaS operators normally need several. Customer churn counts lost paying accounts. Customer retention describes the accounts that remain. Gross revenue churn measures recurring revenue lost to cancellations and contractions. Net revenue churn also credits expansion from existing customers. Each metric answers a different operating question.
This guide follows the opening-base method used by the SolveIndex calculator: customer churn uses customers active at the start of a month, while revenue churn uses starting MRR from the same existing customer base. That keeps the numerator and denominator aligned and prevents new customers from masking retention problems.
What SaaS Churn Rate Measures
Customer churn rate measures the percentage of paying customers that fully leave during a reporting period. For a monthly SaaS churn rate, the denominator is the number of paying customers active at the start of the month. The numerator is the number of those customers that fully cancel during the month.
A downgrade is not the same as customer churn when the customer remains active. That loss belongs in contraction MRR. Likewise, a customer who upgrades does not reduce customer churn. The upgrade is an expansion movement that affects revenue retention and net revenue churn.
Customer churn is sometimes called logo churn because every customer account is counted as one logo regardless of its contract value. This is why customer churn and revenue churn can move in different directions when one segment pays far more than another.
Customer Churn Rate Formula
The standard opening-base formula is simple and reproducible:
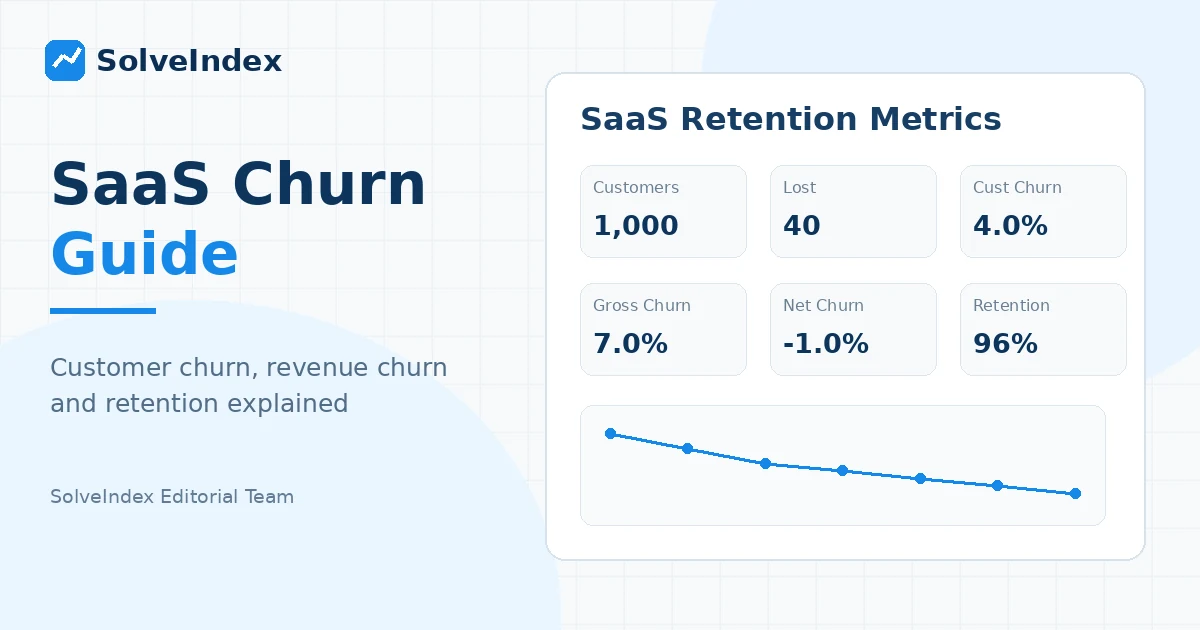
If a company starts the month with 1,000 paying customers and 40 fully cancel, monthly customer churn is 4.0%. Customer retention for that month is 96.0%. These are complementary percentages under this definition.
The denominator matters. Using ending customers after new sales are added can artificially lower the churn rate. If your billing platform uses a different subscriber definition, keep that method consistent across periods and do not compare it directly with an opening-base metric until the definitions are reconciled.
Worked SaaS Churn Rate Example
Assume a SaaS business starts the month with 1,000 paying customers and $100,000 in MRR from those customers. During the month, 40 customers fully churn and remove $5,000 MRR. Existing customers downgrade by another $2,000 MRR and expand by $8,000 MRR.
Customer churn is 40 divided by 1,000, or 4.0%. Customer retention is 96.0%. Gross revenue churn is $7,000 of churn plus contraction divided by $100,000 starting MRR, or 7.0%. Net revenue churn is negative 1.0% because $8,000 of expansion is $1,000 larger than the combined recurring losses.
Existing-customer ending MRR is $101,000. New-customer MRR is intentionally excluded. If the business also added $12,000 MRR from new customers, that new business belongs in a complete MRR bridge, not in the existing-base churn calculation.
| Metric | Calculation | Result |
|---|---|---|
| Customer churn | 40 / 1,000 | 4.0% |
| Customer retention | 960 / 1,000 | 96.0% |
| Gross revenue churn | ($5,000 + $2,000) / $100,000 | 7.0% |
| Net revenue churn | ($5,000 + $2,000 - $8,000) / $100,000 | -1.0% |
| Existing-customer ending MRR | $100,000 - $5,000 - $2,000 + $8,000 | $101,000 |
How to Calculate Churn Rate Correctly
Choose the customer population, reporting interval and cancellation rule before calculating churn. For a monthly SaaS logo churn metric, count customers active at the first moment of the month, then count how many of those customers fully cancel before the month closes.
Decide how failed payments, pauses, grace periods, reactivations and account migrations are classified. If a delinquent account is still considered active during a dunning period, do not classify it as churn until the same event would be recognized as churn in your recurring revenue system.
Use one customer definition across billing, finance and board reporting. A metric can be internally consistent even when another platform uses a different definition, but mixing definitions destroys comparability.
Customer Retention Rate Formula
Customer retention rate measures the percentage of the opening customer base that remains. With a simple opening-base monthly calculation and no reactivation adjustment, retention is 100% minus customer churn.
Retention can also be measured over longer cohort windows, such as the percentage of customers from one year ago that are still active today. A one-month retention rate should not be directly compared with an annual logo retention rate without converting the time horizon.
Customer Retention Rate vs Churn Rate
Under the same opening-base definition, customer retention and customer churn are complements. A 4% monthly customer churn rate corresponds to 96% monthly customer retention. The relationship becomes less direct when a system includes reactivated customers, mid-period starts or other adjustments in one metric but not the other.
Searches for customer retention rate calculator and churn rate calculator often describe the same underlying customer-count data from opposite perspectives. Retention is the share that remains; churn is the share that leaves. Report both when stakeholders find one easier to interpret.
Revenue Churn Rate
Revenue churn weights customer losses by recurring revenue. It is especially important when customer contract values vary because losing one large account can have a much larger financial effect than losing several small accounts.
Use starting MRR from the same opening customer base as the denominator. Churned MRR is recurring revenue lost when customers fully cancel. Contraction MRR is recurring revenue lost when active customers downgrade or reduce recurring usage.
Gross Revenue Churn
Gross revenue churn measures recurring revenue lost from the existing customer base before expansion is considered. It exposes the underlying revenue leakage caused by churn and contraction.
Gross revenue churn cannot be negative under this formula because expansion is excluded. If your result is below zero, the components or signs have been classified incorrectly.
Net Revenue Churn
Net revenue churn asks whether expansion from existing customers offsets churn and contraction. It is the inverse view of net revenue retention for the same existing customer base.
If net revenue churn is 2%, NRR is 98%. If net revenue churn is -4%, NRR is 104%. Use the dedicated NRR Calculator when net and gross revenue retention are the primary decision metrics.
What Negative Revenue Churn Means
Negative net revenue churn means expansion from existing customers is greater than recurring revenue lost to churn and contraction. It can be a powerful growth characteristic because the installed base grows before new-customer MRR is added.
Negative net churn does not mean there is no customer churn. A company can lose many small accounts while a few large accounts expand enough to produce negative net revenue churn. Always compare customer churn, gross revenue churn and net revenue churn together.
Expansion MRR vs New MRR
Expansion MRR comes from customers that were already active at the start of the month. Common sources include upgrades, additional seats, extra recurring modules and recurring usage growth. New MRR comes from customers that were not part of the opening base.
New MRR should not be subtracted from revenue churn or added to NRR because doing so allows acquisition to hide retention weakness. New MRR belongs in total MRR growth. Existing-customer expansion belongs in net revenue churn and NRR.
How to Treat Reactivation MRR
Some SaaS reporting systems treat reactivation MRR as an existing-customer movement, while others present it as a separate bridge component. ChartMogul's net revenue churn methodology can include reactivation when it is part of the existing subscriber base being measured.
The SolveIndex churn calculator does not have a separate reactivation input. Do not silently add new-customer MRR to expansion to compensate. If reactivation is material, use a detailed MRR or NRR bridge that follows your billing platform's documented treatment and state the definition beside the metric.
How to Annualize Monthly Churn
A constant monthly churn rate compounds against the customers that remain. To estimate the annualized rate under a constant monthly assumption, first compound monthly retention for 12 months and then subtract it from one.
At 4% monthly customer churn, monthly retention is 96%. Compounding 96% for 12 months gives about 61.3% annualized retention, so annualized churn is about 38.7% under the steady-rate assumption.
This annualized number is a mathematical comparison, not a cohort forecast. Real churn often changes with customer age, renewal cycles, pricing changes and contract structure.
Why Monthly Churn x 12 Is Misleading
Multiplying 4% monthly churn by 12 gives 48%, but that assumes the same original customer base is available to churn every month. In reality, later months apply churn to a smaller remaining base. Compounding captures that changing denominator.
The reverse problem appears when converting an annual churn rate into a monthly rate. Dividing annual churn by 12 is not generally equivalent to the monthly rate that compounds to the same annual survival. Use consistent compounding when translating periods.
What Is a Good SaaS Churn Rate?
There is no universal SaaS churn rate target. Current benchmark data shows large differences by company scale and account value. Lower-ARPA and earlier-stage businesses usually experience higher churn than mature companies serving larger accounts.
ChartMogul's current benchmark analysis is based on aggregated and anonymized data from more than 2,500 SaaS businesses. The data is useful for context, but a benchmark should not replace cohort-level analysis of your own customer base.
When evaluating a churn rate, match the time period, customer definition, ARR range, ARPA range and business model. A 4% monthly churn rate may be relatively strong for one self-serve segment and weak for a large-enterprise segment.
SaaS Churn Benchmarks by ARR
ChartMogul's current ARR-based data shows the median monthly customer churn rate at about 6.5% for companies below $300k ARR, 4.1% for $300k-$1M ARR, 3.7% for $1M-$3M ARR, 3.8% for $3M-$8M ARR and 3.1% for $8M-$15M ARR. The $15M-$30M band is about 4.1% in the same dataset.
| ARR range | Median monthly customer churn | Top-quartile monthly churn |
|---|---|---|
| Below $300k | 6.5% | 3.2% |
| $300k-$1M | 4.1% | 2.5% |
| $1M-$3M | 3.7% | 2.2% |
| $3M-$8M | 3.8% | 2.3% |
| $8M-$15M | 3.1% | 2.0% |
| $15M-$30M | 4.1% | 1.7% |
These are comparison statistics, not mandatory performance standards. Company mix, pricing, contracts and cohort age can make an individual business materially different from the median.
SaaS Churn Benchmarks by ARPA
Account value is another strong divider. In ChartMogul's current ARPA benchmark, median monthly customer churn is about 6.1% below $25 ARPA, 4.2% at $25-$100, 3.1% at $100-$250, 3.0% at $250-$500, 2.2% at $500-$1,000 and 1.8% above $1,000 monthly ARPA.
Higher-ARPA businesses often have longer sales cycles, more implementation work and deeper customer relationships, so churn can be structurally lower. Lower-ARPA self-serve products can acquire and lose customers more quickly. Compare your churn with a similar economic model.
B2B, Enterprise and Self-Serve Churn
B2B SaaS churn is not one category. A $20 self-serve subscription and a $20,000 enterprise contract have different buying processes, switching costs, renewal cycles and support models. Blended churn across both groups can be operationally misleading.
Enterprise SaaS teams should often track logo churn, gross revenue retention and renewal performance by contract cohort. Self-serve teams may need more frequent monthly or even weekly product-retention analysis. Use the reporting interval that matches the customer lifecycle while keeping official finance metrics consistent.
Use Cohort Analysis for Churn
A company-wide churn rate compresses different customer ages into one average. Cohort analysis groups customers by signup month, plan, segment, geography, acquisition channel or another shared characteristic, then follows retention as the cohort matures.
This reveals whether newer customers are retaining better than older cohorts, whether a pricing change improved customer quality and whether one acquisition channel produces customers that churn unusually quickly.
Cohort analysis is also useful when churn is front-loaded. If many customers leave in the first two months and survivors become stable, one constant churn rate can overstate long-run churn for mature customers while understating onboarding risk.
Voluntary vs Involuntary Churn
Voluntary churn occurs when a customer intentionally cancels or does not renew. Involuntary churn can result from failed payments, expired cards or billing problems. The financial outcome can look similar, but the operational response is different.
Payment retries, card updating, dunning communication and flexible billing can reduce involuntary churn. Product value, onboarding, customer success, pricing and competitive positioning are more important for voluntary churn. Track churn reasons instead of treating every cancellation as the same problem.
Connect Churn With MRR, NRR and GRR
Churned MRR and contraction reduce recurring revenue. Expansion offsets those losses in the existing base. New MRR is then added separately to calculate total MRR movement. Keeping this bridge explicit makes it easier to see whether growth is coming from customer acquisition or from retention and expansion.
Gross revenue retention is the percentage of opening recurring revenue that remains after churn and contraction, excluding expansion. Net revenue retention also includes expansion. Gross revenue churn is 100% minus GRR, while net revenue churn is 100% minus NRR under aligned definitions.
Use the MRR Calculator for a full monthly recurring revenue bridge and the NRR Calculator when retention percentages are the main focus.
How Churn Affects SaaS LTV
Simple SaaS lifetime-value models often estimate customer lifetime as one divided by monthly customer churn. Higher churn shortens estimated lifetime and reduces the gross-margin value available to recover CAC.
This relationship makes churn a critical input in the SaaS LTV:CAC Calculator. The simple formula is sensitive to small churn changes and assumes a constant churn rate, so cohort retention should be used for larger budgeting and valuation decisions.
Use Churn in SaaS Forecasting
A revenue forecast should model how opening recurring revenue moves through churn, contraction, expansion and new business. Applying one historical churn percentage without considering cohort age or renewal timing can make a forecast look more precise than it is.
Forecast by customer segment or contract cohort when economics differ. Review whether churn is seasonal, concentrated at renewal dates or changing after pricing and product updates. Reforecast as actual retention data arrives.
How to Reduce SaaS Churn
Reducing churn usually requires identifying why specific customer groups leave. Improve activation and onboarding when early cohorts fail to reach value. Strengthen customer success when usage declines before cancellation. Improve product reliability and support when churn reasons cluster around service problems.
Pricing and packaging can reduce avoidable contraction when customers can move to a plan that matches usage instead of fully cancelling. Expansion should come from genuine customer value, not from making downgrades artificially difficult.
Track churn reasons, product usage, support signals and payment failures before cancellation. Then compare the intervention with a similar cohort. A falling blended churn rate is more credible when the operational driver is visible.
Common Churn Calculation Mistakes
Common errors include dividing churned customers by ending customers, mixing new customers into the denominator, counting downgrades as customer churn, adding new MRR to expansion, comparing monthly customer churn with annual revenue churn and multiplying monthly churn by 12 instead of compounding retention.
Another mistake is treating negative net revenue churn as proof of excellent customer retention. Expansion from a few large customers can offset revenue loss while many smaller customers still churn. Gross revenue churn and customer churn expose different parts of the picture.
Do not copy a benchmark without matching definitions. The same percentage can describe monthly logo churn, annual logo churn, gross revenue churn or net revenue churn. Label the metric and interval every time.
SaaS Churn Review Checklist
Before publishing a churn metric, confirm the reporting month, opening customer count and opening MRR. Reconcile the list of churned customers with churned MRR. Separate contractions from full cancellations and expansion from new MRR.
Compare customer churn, customer retention, gross revenue churn and net revenue churn. Review cohorts when customer economics differ. If annualizing monthly churn, state that the calculation assumes a constant monthly rate.
Finally, store the definitions with the metric. A consistent method that finance and growth teams can reproduce is more useful than a lower percentage created by changing the denominator.
SaaS Churn Rate Frequently Asked Questions
Sources and Methodology
SolveIndex uses an opening-base customer churn formula and an opening-MRR revenue churn formula so customer and recurring revenue movements can be reproduced from a small set of monthly inputs. The calculator intentionally does not attempt to replace a billing system or a full cohort-retention model.
Current benchmark context was reviewed against ChartMogul's SaaS metrics and benchmark data, which is based on aggregated and anonymized data from more than 2,500 SaaS businesses. Stripe guidance was used to cross-check churn and retention definitions, NRR relationships, forecasting considerations and cohort-analysis practices.
ChartMogul customer churn methodology and benchmarks, ChartMogul customer retention methodology, ChartMogul gross and net revenue churn methodology, Stripe retention vs churn guidance, Stripe SaaS cohort analysis, and Stripe NRR guidance. Benchmarks are comparison tools and do not guarantee a specific business outcome.