CAC payback period measures how many months of customer gross profit are required to recover the cost of acquiring a new paying customer. For SaaS businesses, the metric connects growth spending with cash recovery: sales and marketing costs are paid before a customer has generated enough contribution to repay them.
This guide focuses on SaaS customer acquisition cost payback rather than generic capital-budgeting payback. The calculation uses fully loaded CAC, monthly average revenue per account (ARPA) and gross margin. It should be read alongside LTV:CAC, churn, MRR and NRR because a fast recovery period does not by itself prove strong lifetime economics.
What CAC Payback Period Measures
CAC payback answers a short-term unit-economics question: how quickly does one acquired customer repay the acquisition investment from recurring gross profit? A shorter period generally allows acquisition cash to be recycled sooner. A longer period increases the amount of cash tied up in growth and exposes the company to more churn risk before recovery.
The metric is different from customer lifetime value. LTV estimates the economic value expected over the customer relationship. CAC payback focuses on the point at which cumulative customer contribution has recovered CAC. A company can therefore show an attractive LTV:CAC ratio and still have a recovery period that is difficult to finance.
CAC Payback Period Formula
The SolveIndex calculator uses a gross-margin-adjusted formula so direct service-delivery costs are not treated as available acquisition recovery. Keep all monetary inputs in one currency and align acquisition spend with the customers it produced.
Worked SaaS CAC Payback Example
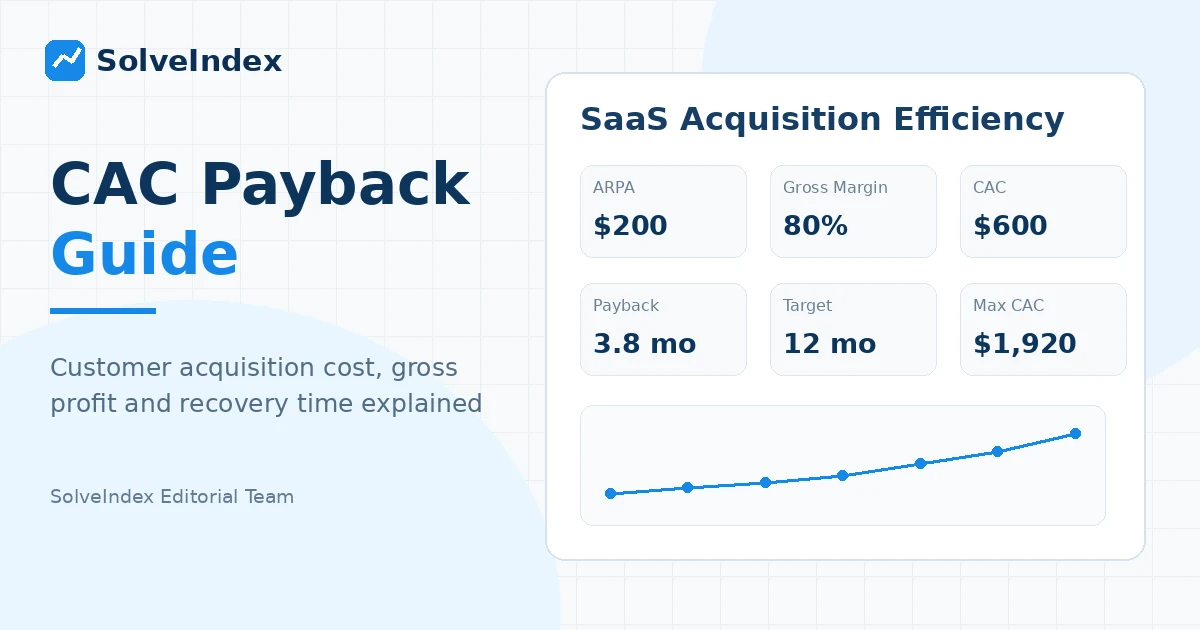
Assume a B2B SaaS company spends $12,000 on marketing, $8,000 on sales and $4,000 on other direct acquisition activity during a quarter. It acquires 40 new paying customers attributable to that period. Total acquisition spend is $24,000, so fully loaded CAC is $600 per customer.
If monthly ARPA is $200 and gross margin is 80%, monthly gross profit per customer is $160. Dividing the $600 CAC by $160 gives a 3.75-month CAC payback period. With a 12-month target, maximum CAC is $1,920 and the current CAC has $1,320 of headroom against that target.
The arithmetic is intentionally simple. It assumes stable monthly ARPA and gross margin and does not automatically model churn before recovery, annual prepayment, onboarding fees, usage expansion, collections delays or changing service cost. Those items should be reviewed separately when they materially affect cash recovery.
| Metric | Calculation | Example |
|---|---|---|
| Total acquisition spend | $12,000 + $8,000 + $4,000 | $24,000 |
| CAC | $24,000 / 40 | $600 |
| Monthly gross profit | $200 x 80% | $160 |
| CAC payback | $600 / $160 | 3.75 months |
| Maximum CAC at 12 months | $160 x 12 | $1,920 |
| CAC headroom | $1,920 - $600 | $1,320 |
How to Calculate Fully Loaded Customer Acquisition Cost
Customer acquisition cost is total acquisition-related spend divided by new paying customers. For a useful SaaS payback model, the numerator should usually include advertising, content production, events, agencies, sales and marketing salaries, commissions, prospecting tools, CRM or marketing automation used for acquisition and other direct costs required to win new customers.
Do not divide the numerator by leads, opportunities, trials or free users when the metric is paid-customer CAC. Those are useful funnel denominators, but they answer different questions. Use new paying customers unless your organization deliberately reports a stage-specific cost metric.
Align CAC Costs and New Customers to the Same Period
A common CAC error is mixing one period of spend with another period of customers. A quarterly sales and marketing cost total should not be divided by one month of new customers. Use the same measurement window or apply a documented lag method when the sales cycle makes same-period matching unrealistic.
Enterprise SaaS often has a multi-month acquisition cycle. In that case, a rolling quarter, trailing average or cohort attribution model may be more representative than same-month CAC. Whatever method is chosen should be repeated consistently so changes in payback reflect the business rather than a changing calculation rule.
CAC Payback Calculator vs Customer Acquisition Cost Calculator
A customer acquisition cost calculator stops after dividing acquisition spend by new customers. A CAC payback calculator adds customer monetization by comparing CAC with monthly gross profit. The same CAC can therefore produce very different payback periods across products or segments with different ARPA and gross margins.
This distinction matters for the high-intent customer acquisition cost calculator search cluster. SolveIndex reports CAC as an output, but the page remains primarily a CAC recovery tool rather than a generic marketing CPA or cost-per-lead calculator.
Use ARPA, MRR and Customer Units Consistently
Average revenue per account should use the same account unit as the customers in the CAC denominator. A simple monthly ARPA calculation is recurring monthly revenue divided by active paying accounts. If acquisition is measured per company account, do not use a per-seat revenue figure unless the denominator is also defined per seat.
ARPA is a recurring-revenue metric, not cash collected. Annual prepayment can improve liquidity even when revenue is normalized to a monthly amount for unit economics. Keep recognized recurring contribution and cash collections conceptually separate.
Why CAC Payback Should Use Gross Margin
Revenue-only payback can make recovery look artificially fast because it assumes every dollar of customer revenue is available to repay acquisition cost. Gross margin adjusts for direct service-delivery costs and produces a more conservative monthly contribution figure.
For SaaS businesses, direct costs may include infrastructure, payment processing, customer support and other costs classified as cost of revenue. Accounting treatment differs across companies, so use the gross-margin definition reconciled to your finance reporting rather than copying an external percentage benchmark.
Model Sales-Cycle Lag for Enterprise SaaS
Long sales cycles create a timing problem: costs incurred in one quarter may produce customers in the next. If the lag is material, compare same-period CAC with a sales-cycle-adjusted version. A finance team may use cohort mapping or a trailing acquisition-cost average so spend is more closely matched with the accounts it generated.
Document whether salaries, commissions and campaign spending are recognized when incurred or when the customer closes. Changing that convention between periods can create a false improvement or deterioration in CAC payback.
Segment CAC Payback by Channel and Customer Type
Company-wide averages can hide actionable differences. Paid search, outbound sales, partnerships, referrals and organic acquisition may have different CACs. Self-serve, SMB, mid-market and enterprise customers may also differ in ARPA, gross margin, onboarding cost and sales-cycle length.
Calculate segment-level payback when sample sizes are large enough to be meaningful. Report the cohort size and measurement period beside the result, because a very small cohort can produce an extreme number that disappears as more customers mature.
Check Churn Before the Payback Month
The simple formula assumes the customer continues contributing until CAC is recovered. If a meaningful share of customers churn before the calculated payback month, average payback may overstate realized recovery. Compare the recovery window with customer retention curves or cohort survival.
This is one reason CAC payback should be paired with LTV:CAC and churn. Payback describes recovery speed for customers that keep contributing, while retention analysis tells you how many customers remain long enough for that recovery to occur.
Annual Prepayment, Discounts and Cash Timing
Annual billing can bring cash forward relative to monthly revenue recognition. Discounts, free months, failed payments and collections delays can push realized cash recovery in the opposite direction. The standard payback formula is an operating unit-economics measure, not a complete cash-flow schedule.
For treasury or runway planning, supplement the simple result with actual invoice timing, collections and contract terms. Do not mix upfront cash collections with monthly recurring revenue inside one formula without clearly changing the definition.
What Is a Good CAC Payback Period for SaaS?
There is no universal healthy payback period for every SaaS business. Stripe describes 12 months or less as a typical healthy SaaS reference and notes that high-performing businesses can recover CAC in roughly five to seven months. Paddle also discusses shorter recovery as more capital efficient. These are comparison points, not mandatory operating rules.
A B2B enterprise segment can tolerate a longer recovery period when contracts are durable, churn is low and expansion is strong, but it also requires more working capital. A self-serve product with shorter contracts and higher churn may need faster recovery. Compare like-for-like segments and prioritize the economics supported by your own cash and retention data.
Turn a Target Payback Into Maximum CAC
A target payback converts monthly gross profit into an acquisition-spending ceiling. If monthly customer gross profit is $160 and the target is 12 months, maximum CAC is $1,920. Actual CAC below that amount has positive headroom; CAC above it misses the chosen target under the current contribution assumptions.
This maximum should not be interpreted as permission to spend up to the ceiling in every channel. Retention uncertainty, channel saturation, sales-capacity constraints and acquisition quality can justify a lower operational CAC target.
CAC Payback vs LTV:CAC Ratio
CAC payback measures the speed of acquisition-cost recovery. LTV:CAC compares acquisition cost with expected lifetime gross profit. They answer complementary questions: payback emphasizes cash efficiency, while LTV:CAC emphasizes lifetime unit economics.
A company can report a 4x LTV:CAC ratio but still face a 24-month payback, which can constrain growth if cash is limited. Another segment may have a lower lifetime ratio but a much shorter payback. Use both metrics with churn and expansion rather than choosing one universal score.
CAC Payback vs Generic Investment Payback
Generic payback-period searches often relate to capital projects and uneven cash flows. CAC payback is narrower: it evaluates customer acquisition spending and recurring customer contribution. The SolveIndex calculator therefore does not model discounted payback, project cash-flow schedules or time value of money.
Keeping that boundary explicit prevents the page from competing for broad finance intent it does not satisfy and keeps the formulas aligned with SaaS growth decisions.
How to Reduce CAC Payback Period
Payback becomes shorter when CAC falls or monthly gross profit per customer rises. Acquisition efficiency can improve through stronger targeting, higher conversion rates, better sales productivity, referrals, organic acquisition and shorter sales cycles. Monetization can improve through pricing, packaging, expansion and reduced discounting.
Gross margin improvements can also shorten payback when they are operationally real, such as infrastructure efficiency or support automation. Avoid improving the reported metric by simply excluding acquisition costs or direct delivery costs from the calculation.
Reduce Customer Acquisition Cost Without Reducing Customer Quality
A lower CAC is valuable only when the acquired customers retain and monetize well. Compare channel CAC with activation, retention, ARPA and expansion rather than moving budget solely toward the cheapest lead source. Low-cost acquisition that produces weak customer quality can lengthen realized payback after churn is considered.
Increase ARPA or Gross Margin Carefully
Higher ARPA shortens simple payback when retention does not deteriorate. Pricing changes, seat expansion, usage growth and better packaging can increase customer contribution. Gross-margin gains can come from lower infrastructure cost, more efficient payment processing or scalable support.
Test whether these changes persist by cohort. A short-term price increase that creates later churn can improve reported monthly payback while weakening lifetime economics.
Common CAC Payback Calculation Mistakes
Frequent errors include dividing marketing spend by leads instead of paying customers, excluding sales salaries and commissions, using different periods for cost and customer counts, using revenue instead of gross profit, applying blended ARPA or margin to unlike segments and treating a benchmark as a guarantee.
Other mistakes include ignoring churn before payback, treating annual cash collection as monthly recurring contribution, changing the cost-allocation method between periods and comparing campaign CPA with fully loaded CAC as though the two metrics were identical.
CAC Payback Review Checklist
Before using the result for a material decision, confirm that acquisition costs and new paying customers are period-aligned, CAC includes a documented set of sales and marketing costs, ARPA and gross margin describe the same customer segment, and customer churn does not make recovery assumptions unrealistic.
Then compare actual payback with the chosen target, LTV:CAC, customer lifetime, billing cadence and cash runway. Segment by channel or customer type when economics differ materially, and save the calculation definitions so future periods remain comparable.
CAC Payback Period Frequently Asked Questions
Sources and Methodology
The page uses Stripe guidance to cross-check SaaS CAC and CAC payback definitions, including period alignment, acquisition-related sales and marketing cost, new paying customers and gross-profit-based payback. Paddle provides additional context on acquisition recovery, segmentation and payback limitations.
Stripe CAC payback period guidance , Stripe SaaS CAC methodology , Paddle payback-period guidance , and Paddle CAC and LTV guidance . These references support definitions and methodology and do not guarantee a specific business outcome.