The Rule of 40 for SaaS combines growth and profitability into one efficiency score. This guide explains the formula, calculation, ARR versus revenue growth, EBITDA versus free cash flow margin, the traditional 40-point benchmark, and why the score should be used with retention, gross margin and capital-efficiency metrics rather than as a standalone verdict.
What the Rule of 40 Measures
The Rule of 40 is a compact SaaS efficiency framework that combines growth and profitability in one score. The idea is simple: faster growth can justify lower near-term margins, while slower growth generally requires stronger cash generation or profitability. The metric is most useful as a balancing lens, not as proof that a company is healthy in every dimension. Retention, gross margin, acquisition efficiency, cash runway, scale and market position still matter.
Rule of 40 Formula
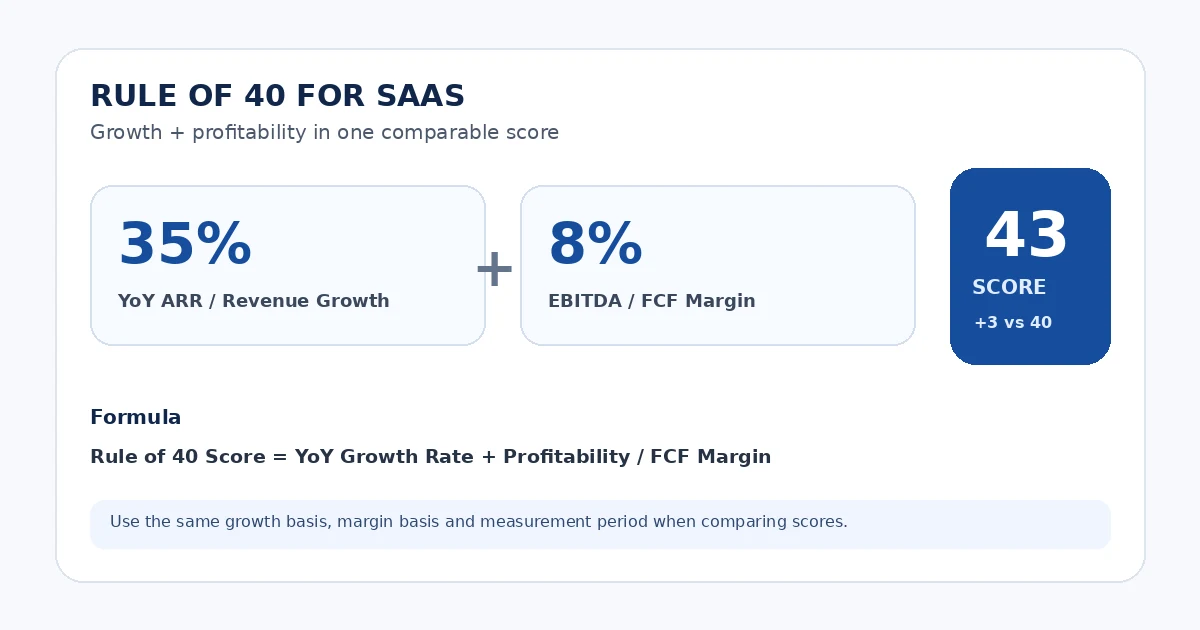
The standard arithmetic is Rule of 40 Score = Growth Rate + Profitability Margin. If a SaaS company grows 35% year over year and produces an 8% profitability or free-cash-flow margin, its score is 43. The inputs are percentage-point contributions, so 35 + 8 = 43. The calculation is easy; the harder part is choosing definitions that are comparable and repeatable.
Why 40 Is the Traditional Threshold
A score of 40 or higher became a widely used shorthand for a SaaS company balancing growth and profitability effectively. It is a convention rather than an accounting standard or physical law. A 40-point score does not mean the company is automatically investable, efficiently financed or appropriately valued; it simply clears the traditional Rule of 40 hurdle under the definitions used.
Growth Rate Component
The growth contribution should represent a clearly defined year-over-year growth rate. SaaS operators often use ARR or recurring-revenue growth; public-company research may use reported revenue growth. The calculator accepts the percentage you choose, but your dashboard should label the basis explicitly. Changing from ARR growth to recognized-revenue growth can move the score even if underlying operations have not changed.
ARR Growth vs Revenue Growth
ARR growth measures the change in annualized recurring run rate, while revenue growth reflects recognized revenue under the company’s accounting policies. They often move together but are not interchangeable. Annual contracts, usage revenue, implementation fees and billing timing can create differences. For a private SaaS operating dashboard, ARR growth is often intuitive; for public-company comparisons, reported revenue growth may be easier to verify.
Use Year-over-Year Growth
Use a year-over-year rate unless a specific framework clearly states otherwise. Month-over-month growth is much more volatile and can make the score look artificially strong or weak because of seasonality, large deals or a small starting base. Align the growth period with the margin period-for example, trailing-twelve-month growth with trailing-twelve-month free-cash-flow margin where practical.
Profitability Margin Component
The second input is a profitability or cash-generation margin. Common Rule of 40 implementations use free cash flow margin or EBITDA margin; some companies use operating margin. Whichever measure you select, document it and keep it consistent. A negative margin is allowed: a company growing 55% with a -10% margin still scores 45, making the growth-versus-burn trade-off visible.
Free Cash Flow Margin
Free cash flow margin measures free cash flow as a percentage of revenue. It directly captures cash generation after operating cash flow and capital expenditures, which is why it appears frequently in investor-oriented Rule of 40 analyses. It can also be noisy around working-capital timing, annual prepayments or unusual capital spending, so use a stable period and understand what drove the cash result.
EBITDA Margin
EBITDA margin is another common profitability input, especially in private-company and transaction contexts. It focuses on operating earnings before interest, taxes, depreciation and amortization. EBITDA and free cash flow can diverge materially because cash taxes, capital expenditures and working-capital movements affect cash but not EBITDA in the same way. Do not compare an EBITDA-based score directly with an FCF-based score without labeling the difference.
Operating Margin
Some teams use operating margin when it is the most consistently available profitability measure. That can be useful internally, but it creates another definition variant. If your historical dashboard uses operating margin, keep it stable or restate prior periods before claiming a trend. The score is only as comparable as its two inputs.
Why Gross Margin Is Not the Profitability Term
SaaS gross margin is an important companion metric, but it is not normally the profitability input in the Rule of 40. Gross margin stops after cost of revenue and does not capture sales and marketing, research and development, general and administrative expense, or the broader cash cost of running the business. Use the dedicated SaaS Gross Margin metric to analyze delivery economics rather than substituting it into the Rule of 40.
Keep Growth and Margin Definitions Comparable
The most common analytical error is comparing scores built from different definitions. ARR growth plus EBITDA margin is not identical to revenue growth plus FCF margin. Decide which framework your company uses, document the source systems, use the same measurement period, and disclose changes. Consistency matters more than trying to engineer the highest possible score.
Worked Rule of 40 Example
Using the calculator defaults, year-over-year growth is 35% and the profitability margin is 8%. The Rule of 40 score is therefore 43. Against the traditional target of 40, the company is 3 points above target. The growth contribution is 35 points and the margin contribution is 8 points, which makes the composition visible rather than hiding it behind the total.
| Metric | Example value |
|---|---|
| YoY ARR / revenue growth | 35% |
| EBITDA / FCF margin | 8% |
| Rule of 40 score | 43 |
| Traditional target | 40 |
| Gap vs target | +3 points |
Understanding a Score Above 40
A score above 40 means the selected growth and margin components sum to more than the traditional hurdle. It does not tell you whether the company is growing efficiently enough for its stage, whether retention is strong, or whether valuation is attractive. A 70-point score driven by 80% growth and -10% margin is a very different operating profile from 35% growth and 35% margin.
Understanding a Score Below 40
A score below 40 is a signal to investigate, not an automatic failure. Early-stage companies may deliberately invest heavily in growth, while mature businesses may accept modest growth if they produce durable cash flow. The useful question is why the score is below target and whether management’s plan can improve growth, margin, or both without damaging long-term value.
Negative Profit Margin
Negative profitability is mathematically valid in the framework. For example, 60% growth and a -15% margin produces a score of 45. This is why the calculator permits negative margin inputs. Extremely negative margins should still trigger deeper analysis of burn, runway and capital efficiency; the Rule of 40 score alone can conceal how much cash is required to sustain the growth.
Growth-Profitability Trade-Off
The framework is designed to make the trade-off explicit. A business can improve its score by growing faster, expanding margin, or doing both. But operational choices interact: cutting sales spend may lift margin while hurting future growth, while aggressive hiring may depress current margin to build future ARR. Use the score alongside leading indicators so a short-term improvement does not mask a weaker future growth engine.
Same Score, Different Businesses
Two SaaS companies can both score 45 and still have very different risk and value profiles. One might grow 45% at breakeven; another might grow 15% with a 30% margin. Their market size, retention, sales efficiency, capital needs and durability can differ substantially. For comparisons, show growth and margin beside the total rather than ranking companies by the score alone.
Rule of 40 by Company Stage
Company stage changes how useful the metric is. Very early SaaS companies often have small revenue bases, volatile growth and intentionally negative margins, which can make the score unstable. As a company reaches meaningful scale, year-over-year growth and profitability become more comparable and the framework becomes more informative for boards, investors and operating plans.
When the Rule Becomes More Useful
The metric is generally more useful once recurring revenue is large enough that one deal or one hiring cycle does not dominate the percentages. Bessemer has historically discussed Rule-of-40-style efficiency in later growth and exit contexts rather than as a rigid seed-stage rule. Treat it as a scale-aware framework: the more mature the revenue base and reporting discipline, the more interpretable the score.
Rule of 40 and NRR
Net Revenue Retention helps explain whether the installed customer base supports durable growth. Strong NRR can make it easier to sustain the growth side of the Rule of 40 because expansion offsets churn and contraction. But NRR is not part of the arithmetic formula. A company can post a high Rule of 40 score while having weak retention if new-customer acquisition is temporarily compensating for losses.
Rule of 40 and Gross Margin
Gross margin influences how much revenue is available to fund sales, product development and overhead, so it matters to the sustainability of the score even though it is not normally added directly. Two companies with the same Rule of 40 score but materially different gross margins may have very different long-term cash-generation potential.
Rule of 40 and CAC Payback
CAC payback measures how quickly gross-margin contribution recovers acquisition cost. It helps explain the quality of growth that the Rule of 40 growth component cannot show. A company may grow rapidly enough to clear 40 while funding inefficient acquisition. Pairing the score with CAC payback helps separate efficient growth from growth purchased at an unsustainable cost.
Rule of 40 and Burn Multiple
Burn Multiple compares net cash burn with net new ARR and is especially useful when the company is still consuming cash. Rule of 40 summarizes growth plus margin; Burn Multiple asks how much cash was burned to create incremental recurring revenue. For high-growth private SaaS, the two metrics answer complementary capital-efficiency questions.
Rule of 40 and SaaS Magic Number
The SaaS Magic Number focuses on sales and marketing efficiency, while Rule of 40 focuses on the overall growth-profitability balance. A company can have a healthy Rule of 40 score but weak sales efficiency if other factors are compensating. Use the Magic Number to diagnose go-to-market efficiency rather than treating the Rule of 40 as a substitute.
Rule of 40 and Valuation
Rule of 40 is often discussed in valuation because efficient growth has historically been associated with stronger software valuation multiples. That relationship does not turn the score into a valuation formula. Interest rates, growth durability, NRR, gross margin, market size, scale and public-market conditions all affect multiples. Use SolveIndex’s SaaS valuation and revenue-multiple tools for direct valuation work.
Rule of 40 vs Rule of X
Bessemer’s Rule of X is a later valuation framework that argues growth should receive more weight than free-cash-flow margin for many public cloud businesses. In its published example, growth is multiplied before adding margin, reflecting the idea that a point of durable growth may create more long-term value than a point of current margin. Rule of X is not a replacement for the operating simplicity of Rule of 40; it is a different valuation-oriented lens.
Rule of 40 for Private vs Public SaaS
Private companies may use ARR growth and EBITDA or FCF margin because those measures align with internal planning and transaction discussions. Public-company analysis often has cleaner reported-revenue and cash-flow data. When benchmarking across private and public businesses, normalize the definitions first; otherwise the apparent ranking may reflect accounting availability rather than operating quality.
Rule of 40 Benchmark Limitations
The number 40 is itself the benchmark, but the distribution around it depends on company size, growth stage, market cycle and input definitions. Do not turn a one-year score into a universal grade. Sustained performance, composition and peer comparability matter. Search demand for “Rule of 40 benchmark” exists, but the most defensible answer is still definition-aware rather than a single industry average.
Setting a Rule of 40 Target
The calculator defaults to a target of 40, but a board may choose a different planning threshold. A high-growth company may accept a temporarily lower margin if growth remains efficient, while a mature company may target more margin as growth normalizes. Keep the target separate from the formula so scenario planning does not change the underlying score definition.
Improving the Growth Contribution
Improving the growth side usually requires better retention, expansion, pricing, pipeline conversion, product-market fit, sales capacity or new products and markets. Favor durable recurring-revenue growth over one-time bookings that do not improve ARR. If growth improves only because the comparison base is unusually weak, call out that base effect in reporting.
Improving the Margin Contribution
Margin improvement can come from pricing, gross-margin improvement, better sales efficiency, disciplined hiring, lower infrastructure cost or reduced overhead. Avoid indiscriminate cuts that damage the product or future pipeline. The goal is not to maximize current margin at any cost; it is to improve the combination of sustainable growth and cash generation.
Common Rule of 40 Mistakes
Common mistakes include mixing monthly growth with annual margins, using gross margin as the profitability term, switching between ARR and revenue growth without restating history, comparing EBITDA-based and FCF-based scores as if they were identical, ignoring negative margins, and treating 40 as a valuation guarantee. Another mistake is showing only the total score without the two components that created it.
Reporting and Dashboard Workflow
Choose the growth definition, choose the margin definition, align the period, document the source systems, calculate both components and the total, and save the methodology with the result. Show the current score beside prior periods and the target, then add NRR, gross margin, CAC payback and Burn Multiple where relevant. That turns a simple sum into a useful operating review.
When Not to Rely on Rule of 40
Do not rely heavily on the metric when the business is pre-scale, growth is distorted by acquisitions, margins are dominated by one-time cash movements, or the two periods are not comparable. It is also insufficient for evaluating solvency, valuation, product-market fit or customer concentration. In those cases, use the underlying operating and financial measures directly.
Frequently Asked Questions
Sources and Methodology
Rule of 40 is a management and investor framework rather than a universal accounting standard. The definition used in this guide was cross-checked against the following software-industry research. When comparing businesses, confirm the growth basis, margin basis and measurement period.
Use the SaaS Rule of 40 Calculator
Enter a year-over-year growth rate, a consistently defined EBITDA or free-cash-flow margin, and your comparison target.
Open the SaaS Rule of 40 Calculator