MRR growth rate measures how fast normalized monthly recurring revenue changes between two comparable reporting points. This guide explains the formula, period selection, dollar-versus-percentage interpretation, ARR run-rate impact, target tracking and the boundaries between MRR growth, base MRR and Net New MRR.
What MRR Growth Rate Measures
MRR growth rate measures the percentage change in normalized monthly recurring revenue between two comparable points. It answers a different question from total MRR: MRR tells you the size of the recurring revenue base, while MRR growth rate tells you how quickly that base increased or decreased over a stated interval.
The metric is most useful when the two values use the same MRR policy. If the first month excludes usage revenue but the second month includes it, the apparent growth can reflect a reporting change rather than business performance. Treat definition consistency as part of the formula, not as an afterthought.
MRR Growth Rate Formula
The standard percentage-change formula is (Current MRR − Previous MRR) ÷ Previous MRR × 100. ChartMogul describes recurring revenue growth rate the same way: the percentage change in MRR from one period to the next. A positive result means the recurring base grew; a negative result means it contracted.
What Counts as MRR
MRR is monthly-normalized recurring subscription revenue. Annual or quarterly subscriptions should be normalized to a monthly amount under one documented policy, while one-time setup fees, implementation projects, hardware and unrelated services generally belong outside MRR. Stripe also distinguishes MRR from total revenue and notes that MRR is not GAAP revenue.
This guide focuses on growth between two already-calculated MRR values. If you need to build MRR from subscriptions first, use the MRR Calculator and matching MRR guide rather than mixing base-MRR intent into this page.
Previous MRR
Previous MRR is the denominator and represents the starting recurring-revenue base for the comparison. It must be greater than zero for a percentage growth rate to be meaningful. The comparison point may be last month, last quarter, the same month last year or another clearly defined date.
Use the MRR value as it stood at the end of the prior period if that is how your reporting system defines period MRR. Do not replace it with average monthly cash receipts or signed bookings unless you are deliberately calculating a different metric.
Current MRR
Current MRR is the recurring-revenue base at the ending comparison point under the same normalization rules as Previous MRR. The difference between current and previous MRR is the absolute change that the growth percentage scales against the starting base.
Current MRR can be lower than previous MRR. That does not make the formula invalid; it simply produces negative growth and signals that recurring-revenue losses exceeded recurring-revenue gains over the stated interval.
Keep MRR Definitions Consistent
Before comparing periods, reconcile the policies behind both values: subscription statuses included, treatment of discounts, foreign-currency conversion, delinquent accounts, usage charges and annual-contract normalization. A change in policy can create a false growth spike or decline.
For board or investor reporting, save the underlying definition with the metric. A clean trend line is only comparable if the data-generating policy remains stable or historical periods are restated consistently.
Absolute MRR Change
Absolute MRR change is simply Current MRR − Previous MRR. It answers “how many recurring dollars changed?” while the percentage growth rate answers “how large was that change relative to where we started?” Both are useful because the same percentage has very different dollar implications at different company sizes.
A $12,000 increase from $100,000 to $112,000 is 12% growth. A $12,000 increase from $1,000,000 to $1,012,000 is only 1.2% growth. Reporting the dollar and percentage together prevents scale from disappearing behind one number.
Percentage Growth vs Dollar Change
Percentage growth helps compare periods or segments with different starting sizes, while absolute growth shows the revenue actually added or lost. Neither should automatically replace the other. A small segment can post a very high percentage from a tiny base, while a mature segment can add more dollars at a lower percentage.
Use percentage growth for rate-of-change analysis and absolute MRR change for operating capacity, hiring, sales targets and annualized run-rate planning.
Worked MRR Growth Example
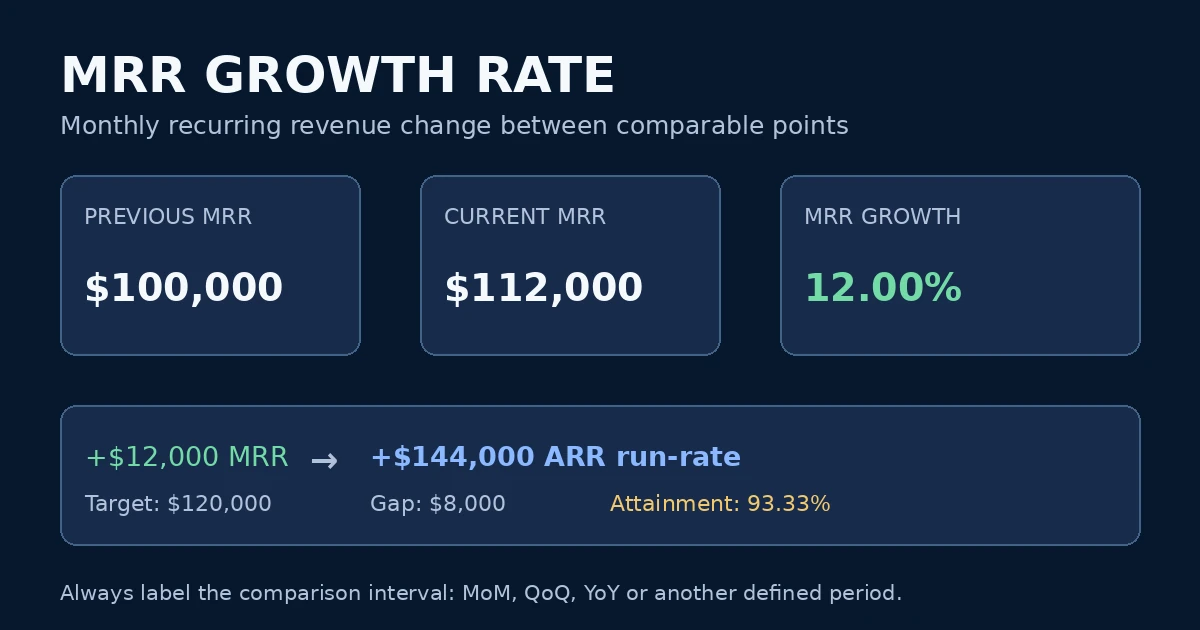
Using the calculator defaults, Previous MRR is $100,000 and Current MRR is $112,000. The absolute increase is $12,000. Dividing $12,000 by the $100,000 starting base produces 12.00% MRR growth.
| Metric | Example value |
|---|---|
| Previous MRR | $100,000 |
| Current MRR | $112,000 |
| Absolute MRR change | +$12,000 |
| MRR growth rate | 12.00% |
| ARR run-rate change | +$144,000 |
| Target MRR | $120,000 |
| Gap to target | $8,000 |
| Target attainment | 93.33% |
The example is arithmetic, not a benchmark. Whether 12% is strong depends on the interval and company context. A 12% monthly increase is dramatically different from a 12% annual increase.
Negative MRR Growth
MRR growth becomes negative when Current MRR is below Previous MRR. For example, a fall from $100,000 to $94,000 is a $6,000 decline and a -6% growth rate. The sign is informative; do not convert a decline to a positive “churn percentage” and call it MRR growth.
To diagnose the decline, move from the headline rate to MRR movements: churn, contraction, new business, expansion and reactivation. The growth rate shows the outcome, not the mechanism.
When Previous MRR Is Zero
A percentage growth rate cannot be calculated from a zero starting base because the formula divides by Previous MRR. A new SaaS company moving from $0 to $10,000 MRR has gained $10,000 of recurring revenue, but the percentage growth from zero is mathematically undefined.
In that situation, report the absolute MRR created, milestone attainment and the next comparable growth interval after a nonzero baseline exists.
The Comparison Interval Matters
The same formula works across monthly, quarterly and annual comparisons, but the interpretation changes with the interval. Always label the rate. “MRR grew 8%” is incomplete; “MRR grew 8% month over month” or “MRR grew 8% year over year” is decision-ready.
ChartMogul's growth reporting explicitly supports different period views such as day-over-day, week-over-week, month-over-month, quarter-over-quarter and year-over-year. Matching the interval is essential when comparing your result with a dashboard or benchmark.
Month-over-Month MRR Growth
Month-over-month growth compares ending MRR for one month with the immediately preceding month. It is sensitive to large deals, churn events, billing migrations and seasonality, which makes it useful for operating cadence but potentially noisy.
Use several months of MoM history rather than declaring a trend from one exceptional month. If the business has lumpy enterprise contracts, segment-level and trailing views can add context.
Quarter-over-Quarter MRR Growth
Quarter-over-quarter growth can smooth some month-level volatility, but you still need one consistent definition of what the quarterly comparison point represents. A common approach is to compare quarter-end MRR with the previous quarter-end MRR.
Do not add three month-end MRR balances together; MRR is a run-rate snapshot, not a monthly revenue flow to be summed across the quarter.
Year-over-Year MRR Growth
Year-over-year growth compares MRR with the same point one year earlier. It can reduce seasonality and is easier to relate to annual company-growth benchmarks, but it reacts more slowly to recent acceleration or deterioration.
For board reporting, YoY MRR growth is often easier to interpret alongside ARR, NRR, GRR and cash-efficiency metrics because the period is explicit and comparable across years.
Do Not Blindly Annualize a Monthly Percentage
Multiplying a monthly growth percentage by 12 assumes simple linear behavior and ignores compounding. Compounding a monthly rate for a full year assumes the exact rate repeats every month, which may also be unrealistic. Both can create false precision.
Use the calculator's annualization only for the dollar MRR change: $12,000 of added MRR corresponds to $144,000 of annualized recurring-revenue run-rate impact if that monthly recurring level persists. That is different from annualizing the 12% percentage.
ARR Run-Rate Impact
The calculator multiplies absolute MRR change by 12 to show the annualized recurring-revenue run-rate change. From the default example, +$12,000 MRR translates to +$144,000 annualized run rate.
This is a run-rate translation, not proof that $144,000 of accounting revenue has already been recognized or will definitely be collected. Stripe similarly distinguishes recurring run-rate metrics from recognized revenue and notes that MRR is not GAAP revenue.
MRR Growth vs ARR Growth
If ARR is defined consistently as MRR × 12, then the percentage change between two corresponding ARR values is mathematically the same as the percentage change between their MRR values. The dollar change differs by the 12× scale.
However, companies sometimes use contract-based ARR definitions that do not map perfectly to MRR. Compare definitions before assuming the growth rates are interchangeable across tools.
MRR Growth Rate vs Net New MRR
Net New MRR explains the dollar movement created by recurring-revenue components. MRR growth rate scales the overall change relative to Previous MRR. They are connected but not substitutes.
If Previous MRR is $100,000 and net recurring movements add $12,000, ending MRR becomes $112,000 and the MRR growth rate is 12%. The net-new metric explains the $12,000; the growth-rate metric explains its size relative to the starting base.
MRR Movements Behind Growth
A headline growth rate is the result of several operating forces. New MRR adds recurring revenue from newly acquired customers; expansion MRR adds recurring revenue from existing customers; reactivation can bring previously churned customers back; contraction and churn reduce the base.
Use movement-level reporting when growth changes sharply. Two companies can both grow MRR 10% while having completely different retention, acquisition and expansion economics.
New MRR and Expansion MRR
New MRR and expansion MRR are positive recurring-revenue movements, but they represent different growth engines. New MRR depends on acquisition; expansion MRR depends on existing-customer upsells, seats, add-ons or usage.
A growth plan relying mostly on new business can behave differently from one supported by strong expansion. Use the dedicated Expansion MRR guide when the source of existing-customer growth is the main question.
Churn and Contraction
Churn removes recurring revenue when a customer relationship ends; contraction reduces recurring revenue while the customer remains. Both lower ending MRR and therefore drag on MRR growth.
If headline growth slows despite strong new business, rising churn or contraction may be absorbing the gains. That is why MRR growth should be read beside retention and movement metrics rather than celebrated in isolation.
MRR Growth and NRR
NRR measures recurring revenue retained from a starting customer cohort after expansion, contraction and churn. MRR growth measures the total recurring-revenue base across comparison points and can include new-customer contribution. Strong NRR can support MRR growth, but NRR is not the same metric.
Keep direct NRR analysis on the dedicated NRR Guide. This page uses NRR only to explain one driver of total recurring-revenue growth.
Target MRR
Target MRR is a planning input, not part of the MRR growth-rate formula. In this SolveIndex calculator the target is required because the tool also returns target gap and target attainment. If you only need the growth rate, the result itself still depends only on Previous MRR and Current MRR.
Set the target for the same future or current reporting point being evaluated. Mixing a monthly target with a quarterly current value makes the attainment output meaningless.
Gap to Target MRR
Gap to target is Target MRR − Current MRR. A positive gap means current MRR is below the target; a zero or negative gap means the target has been met or exceeded.
Because this output is a dollar amount, it can translate a percentage-growth discussion into the recurring revenue still required from new business, expansion or retention improvements.
Target Attainment
Target attainment is Current MRR ÷ Target MRR × 100. With $112,000 current MRR and a $120,000 target, attainment is 93.33%.
Attainment should not be mistaken for growth. A company can be above target while shrinking versus the prior period, or below target while still growing rapidly. Use both measures to separate plan performance from actual period-over-period movement.
Segment MRR Growth
Company-wide growth can hide different patterns across plans, regions, acquisition channels or customer sizes. Segment MRR growth uses the same percentage-change formula but applies it to a consistently defined subset.
ChartMogul recommends segmentation when analyzing recurring-revenue growth. Segment-level comparisons can reveal whether growth is broad-based or dependent on one plan, geography or handful of large customers.
Seasonality and Large Deals
Monthly MRR growth can jump when a large contract starts and fall when one large account churns. Seasonal acquisition patterns can also create recurring peaks and troughs. These are real changes, but they can distort a single-period interpretation.
Use longer history, segment analysis and year-over-year comparisons to distinguish underlying momentum from timing effects.
Usage-Based and Variable Revenue
Usage-based SaaS can make MRR normalization less straightforward because revenue changes with consumption. Use the same documented treatment in both periods and understand how your billing or analytics system classifies variable recurring charges.
If the MRR methodology changes as pricing evolves, restate historical comparisons where practical or mark the break in the series rather than presenting an artificial growth jump.
Currency and Reporting Changes
Multi-currency businesses should compare values after applying one consistent currency-conversion methodology. Exchange-rate movement can change reported MRR even when underlying local-currency subscriptions are stable.
Likewise, migrations between billing systems or changes in delinquency rules can create apparent growth. Reconcile unusual jumps to source systems before using the number for planning or external communication.
What Is a Good MRR Growth Rate?
There is no universal good MRR growth rate. Company size, stage, pricing, market, funding model and the comparison interval all matter. The useful benchmark question is not “Is 10% good?” but “10% over what period, at what scale, and compared with which peers?”
ChartMogul benchmarks recurring-revenue growth against peer groups and allows context by ARR or ARPA. Use peer segmentation when available rather than converting an annual market benchmark into an unsupported monthly target.
2026 SaaS Growth Benchmark Context
SaaS Capital's 2026 private B2B SaaS research reports a 22% median annual growth rate across the surveyed population, with bootstrapped companies at about 20% median and equity-backed companies at about 25% median. These figures are annual company-growth context, not a monthly MRR-growth target.
Use them only when your comparison interval and company profile are reasonably comparable. For monthly operating decisions, your own historical MoM baseline and a SaaS benchmark segmented by scale are usually more actionable.
How to Improve MRR Growth
MRR growth can improve by increasing positive movements or reducing negative ones: acquire more qualified customers, improve activation and conversion, expand existing accounts, reduce involuntary churn, strengthen retention, optimize packaging and pricing, and remove friction from upgrades.
Diagnose the movement mix before choosing the intervention. If churn is the problem, adding more acquisition can mask the leak without fixing it. If retention is strong but growth is slow, acquisition capacity or expansion may be the more relevant constraint.
Common MRR Growth Mistakes
Common mistakes include mixing monthly and annual intervals, comparing differently normalized MRR, including one-time revenue, treating bookings as MRR, annualizing a monthly percentage by simply multiplying by 12, and calling ARR run-rate change recognized revenue.
Another mistake is letting generic MRR definitions cannibalize the growth analysis. Calculate the MRR base consistently, then use this metric specifically for change between comparable points.
Practical MRR Growth Reporting Workflow
First, lock the MRR definition and reporting currency. Second, select two comparable dates and label the interval. Third, calculate absolute MRR change and percentage growth. Fourth, reconcile the dollar change to new, expansion, reactivation, contraction and churn movements where available.
Finally, compare the result with target MRR, prior periods and a relevant benchmark. Save the definition and interval beside the number so future readers can reproduce the result instead of guessing what “MRR growth” meant in that dashboard.
Frequently Asked Questions
Sources and Methodology
The formulas and terminology in this guide were cross-checked against current subscription-metrics documentation and 2026 SaaS benchmark research. MRR growth is a management metric, so comparisons should match both the recurring-revenue definition and the reporting interval.
Use the MRR Growth Rate Calculator
Enter comparable previous and current MRR values, plus a positive planning target, to calculate growth rate, absolute MRR change, annualized run-rate impact, target gap and attainment.
Open the MRR Growth Rate Calculator