The SaaS Magic Number measures how efficiently lagged sales and marketing spend converts into annualized revenue growth. This guide covers the formula, measured benchmark ranges, the built-in one-quarter lag, revenue-recognition limits, sales-cycle effects and comparisons with CAC payback, Burn Multiple and Rule of 40.
What Is the SaaS Magic Number?
The SaaS Magic Number is a sales-and-marketing efficiency metric that compares annualized quarter-over-quarter revenue growth with the previous quarter's sales and marketing expense. In plain language, it asks how much annualized incremental revenue the company is producing for each dollar of lagged sales and marketing spend.
The metric is most useful as a fast operating signal, not as a full unit-economics model. It can help a finance or go-to-market team decide whether recent sales and marketing investment appears productive enough to scale, but it does not tell you gross margin, customer-level CAC, payback time, retention quality or total cash efficiency.
What the Magic Number Measures
The Magic Number measures the relationship between a company-level revenue outcome and a company-level acquisition-spend input. Because the numerator is net revenue growth, it can reflect several forces at once: new customers, expansion from existing customers, churn, contractions, pricing changes and revenue-recognition timing.
That makes the metric broader than a pure new-logo acquisition ratio. A strong score may come from excellent new-business productivity, strong expansion, low churn or a combination of these factors. Diagnose the components before concluding that the sales team alone caused a high or low result.
SaaS Magic Number Formula
The classic public-company version uses recognized quarterly revenue because revenue and sales-and-marketing expense are available from reported financial statements. Subtract the prior quarter's revenue from the current quarter's revenue, annualize that increase by multiplying by four, then divide by the prior quarter's sales and marketing expense.
Keep every term on a consistent accounting basis. If one quarter includes a material services business, acquired revenue, a reporting reclassification or a different S&M cost policy, the resulting comparison may reflect accounting scope changes rather than operating efficiency.
Quarterly Revenue Change
The numerator starts with the change in recognized revenue between two consecutive quarters. In the SolveIndex default example, revenue rises from $1.15 million to $1.30 million, so the quarterly increase is $150,000. A positive change produces a positive numerator; a decline produces a negative numerator.
Use the same revenue definition in both quarters. Do not compare subscription-only revenue in one quarter with total revenue in the next. If professional services, hardware or implementation fees are meaningful and volatile, consider tracking a recurring-revenue-focused management version alongside the classic reported-revenue version, while labeling the two definitions clearly.
Why Multiply Revenue Growth by Four?
Multiplying the quarterly revenue increase by four annualizes one quarter of growth. A $150,000 quarterly increase becomes a $600,000 annualized increase. This does not mean the company is guaranteed to earn an additional $600,000 over the next year; it is a run-rate-style normalization used by the metric.
The annualization step is one reason quarter boundaries matter. If the quarter contains an unusually large deal, acquisition, churn event or seasonal billing pattern, multiplying that one-period movement by four can magnify a temporary effect. Treat the annualized amount as a standardized comparison input, not as a forecast.
Why Use Prior-Quarter S&M?
The denominator intentionally uses the previous quarter's sales and marketing expense. The metric assumes there is a lag between spending money on sales capacity or marketing programs and seeing the resulting revenue in financial statements. That lag is imperfect, but it is more realistic than assuming every dollar spent this quarter converts into revenue immediately.
For short, transactional sales cycles, one-quarter lag may be a reasonable approximation. For enterprise businesses with six-, nine- or twelve-month sales cycles, the prior-quarter denominator can be too short. In those cases, track a longer-lag or trailing-period management view as a supplement rather than pretending one formula fits every go-to-market motion.
What Counts as Sales & Marketing Expense?
Use one documented sales and marketing cost scope every period. For a public-company-style calculation, the denominator is typically the reported sales and marketing operating-expense line. Internal management versions may further analyze payroll, commissions, advertising, events, software, contractors and allocated costs.
The key is consistency. Do not use fully loaded S&M in one quarter and direct advertising plus commissions in another. Also avoid comparing your Magic Number with a peer unless you understand whether both companies classify customer success, partner commissions, implementation teams and stock-based compensation the same way.
Recognized Revenue vs ARR, MRR and Bookings
The classic Magic Number uses recognized quarterly revenue, not ARR, MRR, bookings or cash collections. ARR and MRR are recurring-revenue run-rate metrics, while bookings represent signed contract value and cash collections reflect payment timing. These measures can move differently in the same quarter.
For a subscription company with little nonrecurring revenue, recognized revenue growth may track recurring revenue reasonably well. For a business with large services fees, usage spikes or implementation revenue, the distinction becomes more important. State the numerator definition explicitly whenever the score is used in a board deck or peer comparison.
Worked SaaS Magic Number Example
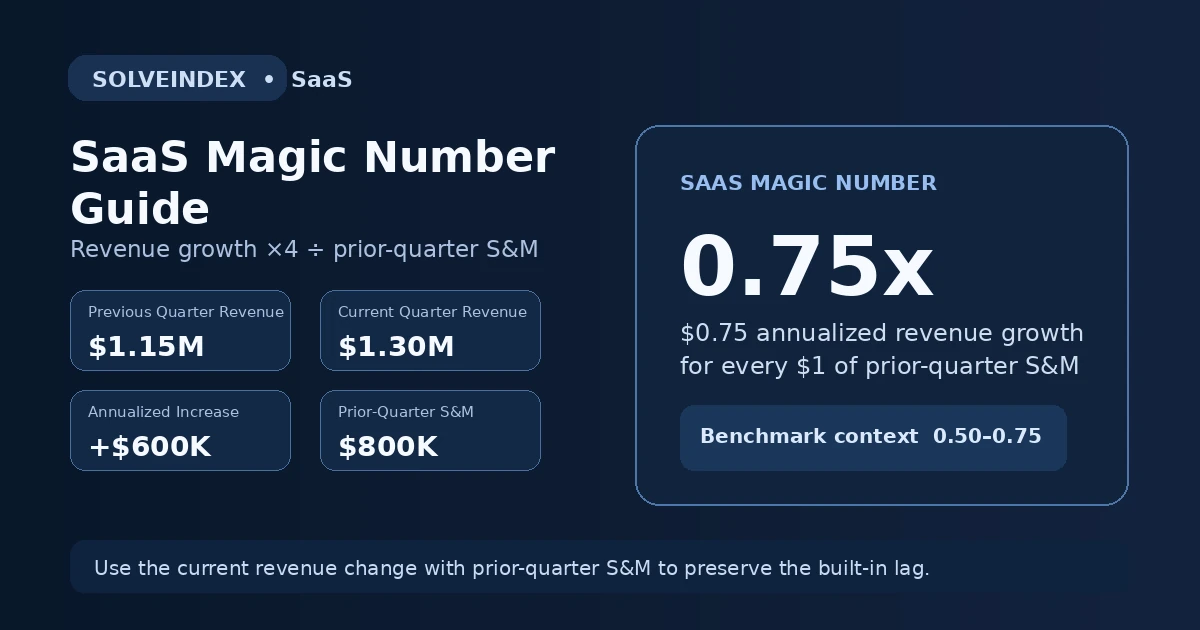
Using the calculator defaults, current-quarter revenue is $1.30 million and previous-quarter revenue is $1.15 million. The $150,000 increase is multiplied by four to produce $600,000 of annualized incremental revenue. Dividing $600,000 by the previous quarter's $800,000 of S&M expense produces a SaaS Magic Number of 0.75.
This worked example is deliberately reproducible. If you want to test an operating scenario, change one driver at a time, for example, current revenue or prior-quarter S&M, and observe how the score changes. That is more informative than changing revenue, spend, churn and pricing simultaneously.
| Metric | Example value |
|---|---|
| Previous quarter revenue | $1,150,000 |
| Current quarter revenue | $1,300,000 |
| Quarterly revenue increase | $150,000 |
| Annualized revenue increase | $600,000 |
| Previous-quarter S&M expense | $800,000 |
| SaaS Magic Number | 0.75 |
How to Interpret a 0.75 Magic Number
A score of 0.75 sits at a commonly cited threshold where sales and marketing efficiency may be strong enough to consider additional investment. It means the annualized revenue increase is 75 cents for each dollar of prior-quarter S&M expense under the chosen definitions.
Do not interpret 0.75 as a guarantee of attractive economics. The metric ignores gross margin and does not show customer-level payback. A company with an 85% gross margin and a company with a 45% gross margin can report the same Magic Number while having very different cash economics.
Magic Number Below 0.50
A score below 0.50 is commonly treated as a signal to investigate efficiency before materially increasing spend. Possible causes include weak conversion, poor targeting, long sales cycles, excess sales capacity, declining retention, slower expansion or an S&M ramp whose revenue has not appeared yet.
Before cutting spend, identify which cause is responsible. A deliberately front-loaded hiring plan may temporarily reduce the score while building capacity for future quarters. A structurally weak conversion funnel requires a different response from a healthy team that simply has a long revenue lag.
Magic Number from 0.50 to 0.75
The 0.50-to-0.75 range is a diagnostic middle zone rather than a failure band. The business may be producing acceptable returns but not yet showing a strong signal to accelerate. Compare conversion, pipeline coverage, win rate, average contract value, gross margin and CAC payback before changing budget.
Trend matters more than one snapshot. A sequence such as 0.42, 0.55, 0.66 and 0.73 tells a different story from 0.92, 0.81, 0.64 and 0.55 even though both companies may currently sit in the same broad range.
Magic Number Above 0.75
Above 0.75 is commonly interpreted as efficient sales and marketing conversion, especially when the result is sustained across several quarters. It can support a case for investing more in proven channels or sales capacity, assuming gross margin, retention, runway and pipeline quality are also healthy.
A very high score is not automatically a reason to spend aggressively. It may result from unusually strong expansion, a one-time enterprise deal, delayed hiring, underinvestment in growth or timing effects. Diagnose the source of the efficiency before treating it as durable capacity.
Can the Magic Number Be Above 1.0?
Yes. A Magic Number above 1.0 means annualized revenue growth exceeded prior-quarter S&M expense under the formula. That can indicate highly productive go-to-market spend, but it can also mean the company is underinvesting relative to an attractive market opportunity.
When a score stays well above one, look at pipeline demand, capacity constraints, sales-cycle length, customer success resources and gross-margin economics. The decision is not simply to maximize the ratio; it is to allocate capital where incremental returns remain attractive.
Can the Magic Number Be Negative?
Yes. If current-quarter recognized revenue is below previous-quarter revenue, the revenue-change numerator is negative and the Magic Number becomes negative. The calculator intentionally supports this because a declining revenue base is an important sales-efficiency signal.
A negative score should trigger a movement diagnosis rather than a mechanical benchmark comparison. Determine whether the decline came from churn, contraction, seasonality, services timing, loss of a large customer, foreign-exchange effects or an accounting reclassification before attributing the outcome to S&M performance.
Magic Number Benchmark Caveats
Common benchmark bands are useful shortcuts, not universal targets. ChartMogul currently frames above 0.75 as a commonly cited signal of strong efficiency, 0.50 to 0.75 as acceptable but inconclusive, and below 0.50 as a reason to improve efficiency before scaling.
Benchmark comparability depends on revenue definition, S&M scope, sales-cycle length, gross margin, market segment, pricing model and company stage. Use peer benchmarks as context, then anchor operating decisions in your own multi-quarter trend and marginal returns on additional spend.
Sales-Cycle Lag
The Magic Number embeds a one-quarter lag, but real sales cycles can be shorter or much longer. Product-led and SMB motions may convert in days or weeks, while enterprise opportunities can take multiple quarters. A one-quarter formula can therefore overstate or understate the causal relationship between spend and revenue.
For longer cycles, supplement the standard score with a trailing or lag-adjusted view. Keep the classic calculation for market comparability, but use the operating version that best matches your actual pipeline conversion cycle for internal planning.
Enterprise vs SMB Sales Motions
Enterprise SaaS often carries larger contract values, longer procurement cycles and lumpier close patterns. One deal can materially move quarterly revenue while several quarters of S&M investment preceded it. That makes quarter-level Magic Numbers more volatile.
SMB and self-serve models generally have shorter, higher-volume sales cycles, so the one-quarter lag may map more closely to actual spend-to-revenue conversion. Even there, seasonality and channel mix can distort a single quarter, which is why a trend is still preferable.
Hiring and S&M Spend Ramps
When a company hires salespeople or increases marketing spend, the denominator can rise before the new capacity produces revenue. A temporary decline in the Magic Number can therefore be expected during a deliberate ramp. The important question is whether pipeline, productivity and later revenue improve on schedule.
Conversely, a company that freezes hiring can show a temporarily strong score because revenue continues to grow on an older cost base. Pair the Magic Number with rep ramp data, pipeline creation and sales capacity so the efficiency ratio is not interpreted without operating context.
Revenue Recognition Timing
Recognized revenue follows accounting rules and may lag bookings, billings and contract signatures. Annual prepayments, multi-year deals, services revenue and usage-based billing can create different timing patterns between commercial activity and reported revenue.
This is why two companies with similar bookings productivity can show different Magic Numbers. For internal management, reconcile major timing effects and consider a complementary ARR- or bookings-based sales-efficiency metric while preserving the classic revenue-based score for standardized comparisons.
Expansion Revenue Effect
Total revenue growth can include expansion from existing customers. If a customer-success or product-led expansion motion is strong, the Magic Number may improve even if new-logo acquisition efficiency is unchanged. That is not mathematically wrong; it simply means the score reflects broader net revenue growth.
If management wants a new-business-only view, calculate a separate acquisition-efficiency measure rather than relabeling the standard Magic Number. Keep definitions explicit so one team does not compare a net-growth version with another team's new-logo version.
Churn and Contraction Effect
Churn and contraction reduce net revenue growth, which can depress the Magic Number even when new bookings are healthy. That makes the metric partly sensitive to retention quality. Weak onboarding, product gaps or customer-success issues can therefore appear as a go-to-market efficiency problem.
Pair the score with NRR, GRR and revenue churn to separate acquisition productivity from customer-base durability. If sales efficiency looks weak while gross new ARR is strong, retention may be the hidden driver.
Gross Margin Limitation
The standard Magic Number does not include gross margin. It measures annualized revenue created per dollar of S&M, not gross profit created per dollar of S&M. A lower-margin business therefore needs stronger revenue efficiency to produce the same cash return as a high-margin SaaS company.
This limitation is one reason CAC Payback is a useful companion metric. Payback explicitly incorporates gross margin in many SaaS implementations, which converts acquisition efficiency into a more economically intuitive recovery period.
Magic Number vs CAC
CAC measures average acquisition cost per new customer or account, usually by dividing acquisition spend by the number of new customers acquired. The Magic Number does not require a customer count; it uses company-level revenue growth and prior-quarter S&M.
Magic Number vs CAC Payback
CAC Payback estimates how many months of gross-margin contribution are needed to recover customer acquisition cost. The Magic Number is an aggregate revenue-efficiency ratio and does not directly include gross margin or customer-level acquisition cost.
They are related but not interchangeable. A Magic Number near one is sometimes loosely associated with roughly one year of revenue payback under simplified assumptions, but actual economic payback depends on gross margin, retention, implementation costs and which S&M expenses are attributed to acquisition.
Magic Number vs Burn Multiple
Burn Multiple measures total capital efficiency by dividing Net Burn by Net New ARR. Magic Number focuses specifically on sales and marketing productivity. A company can have an efficient sales engine but still show a poor Burn Multiple because R&D, infrastructure or general operating costs consume substantial cash.
Use Magic Number to diagnose the go-to-market engine and Burn Multiple to understand how much total cash the company consumes to create recurring-revenue growth. Neither metric substitutes for the other.
Magic Number vs Rule of 40
The Rule of 40 adds a growth rate to a profitability or free-cash-flow margin. It asks whether growth and profitability together clear a chosen efficiency threshold. Magic Number instead compares revenue growth with lagged S&M spend.
A strong Magic Number can coexist with a weak Rule of 40 if total operating expenses are high. A strong Rule of 40 can coexist with a moderate Magic Number if margins are excellent. The metrics answer different capital-allocation questions.
Magic Number vs MRR Growth Rate
MRR Growth Rate measures the percentage change in normalized monthly recurring revenue between two comparable points. It does not include S&M spend. Magic Number asks how efficiently lagged S&M expense translated into annualized quarterly revenue growth.
Use MRR Growth to measure growth speed and Magic Number to add an acquisition-spend efficiency lens. Keep recognized revenue and MRR distinct rather than substituting one for the other without documenting the changed methodology.
Seasonality and Large Deals
Seasonality can make quarter-over-quarter revenue changes uneven, especially around year-end procurement cycles or annual renewals. Large enterprise wins or losses can also dominate a single quarter. Annualizing that movement by four can exaggerate a temporary pattern.
Compare the same seasonal quarter year over year, inspect deal concentration and use trailing averages before changing budget based on one unusual quarter. A score should represent a repeatable commercial engine, not a single exceptional contract.
Quarterly Volatility
Because the formula uses only two adjacent revenue points and one quarter of S&M expense, it is naturally sensitive to timing. Small changes in close dates or recognized revenue can move the ratio sharply when the denominator is small.
Using Trailing Averages
A rolling three- or four-quarter average can reduce noise while preserving the direction of the metric. Another approach is to calculate several quarterly Magic Numbers and review the median or trend rather than blending every input into one opaque figure.
How to Improve the SaaS Magic Number
The ratio improves when annualized revenue growth rises faster than prior-quarter S&M expense. That can happen through better conversion, higher contract values, shorter sales cycles, stronger expansion, improved retention or more disciplined spending. The right lever depends on where the funnel is constrained.
Avoid optimizing the ratio by simply cutting productive spend. If the business has strong incremental returns and a large market opportunity, a temporarily lower Magic Number may be rational while building future growth capacity. Optimize long-term economic output, not the appearance of one ratio.
Improve Sales Efficiency
Improve sales efficiency by tightening ideal-customer targeting, increasing qualified pipeline, improving win rates, reducing time-to-productivity for new representatives and removing process bottlenecks. Segment the score by sales motion where possible so enterprise and SMB economics do not hide each other.
Watch quota attainment, pipeline coverage, sales-cycle length, average contract value and ramp time alongside the Magic Number. If the ratio falls while these leading indicators improve, the problem may be timing rather than fundamental productivity.
Improve Marketing Efficiency
Improve marketing efficiency by shifting spend toward channels that create qualified pipeline, strengthening conversion from lead to opportunity, reducing low-intent acquisition and improving messaging for high-value segments. Evaluate contribution to revenue, not just traffic or lead volume.
Attribution is imperfect, so do not expect the Magic Number to identify the winning channel by itself. Use channel-level CAC, sourced pipeline, influenced pipeline and conversion data to understand why the company-level ratio changed.
Common Magic Number Mistakes
Common mistakes include using current-quarter S&M instead of prior-quarter S&M without documenting the change, mixing ARR with recognized revenue, including a one-time revenue spike, changing the S&M cost scope between periods, and comparing companies with very different sales cycles as if their scores were directly equivalent.
Another mistake is treating 0.75 or 1.0 as a universal target. Benchmark bands are useful, but gross margin, retention, company stage and incremental return on capital matter. Finally, do not use one quarter in isolation when hiring, enterprise deal timing or seasonality can explain the movement.
Frequently Asked Questions
Sources and Methodology
The formulas and benchmark ranges in this guide were cross-checked against current and established SaaS methodology sources. The Magic Number is a management metric rather than a universal accounting standard, so companies should document their revenue definition, S&M scope and lag convention and apply them consistently.
Use the SaaS Magic Number Calculator
Enter current and previous quarterly revenue plus previous-quarter sales and marketing expense to reproduce the formula and test alternative scenarios.
Open the SaaS Magic Number Calculator