Logo retention - also called customer retention in many B2B SaaS teams - tracks how many paying customer accounts from a starting cohort remain. This guide explains the formula, logo churn, new-logo treatment, benchmarks, customer retention strategies and the differences from revenue retention.
What Logo Retention Measures
Logo retention measures the percentage of paying customer accounts from a defined starting cohort that remain paying at the end of a reporting period. In B2B SaaS, each customer company or account is often treated as one “logo,” so the metric answers a simple question: how many of the customers we started with did we keep?
This is a customer-count metric, not a revenue-weighted metric. A $500-per-month account and a $50,000-per-month account each count as one retained logo. That makes logo retention useful for understanding customer durability, but it should be paired with GRR, NRR or revenue churn when account sizes vary materially.
Logo Retention vs Customer Retention
In SaaS reporting, logo retention and customer retention are often the same concept. ChartMogul explicitly uses “customer retention” and “logo retention” as interchangeable labels for the percentage of paying customers retained from a starting cohort. Stripe likewise describes logo retention as the percentage of companies that continue to pay for a SaaS product.
The word “logo” is especially useful in B2B SaaS because one customer company can contain many users or seats. If your business sells to individual consumers instead of company accounts, customer retention may be the clearer label. The key is to define the counted entity and keep that definition stable.
What Counts as a Logo in SaaS
A logo should represent one unique paying customer entity under a documented rule. Depending on your billing model, that may be a legal company, contracted customer, parent account or billing account. Do not switch between company-level and workspace-level counting from one period to the next.
Multi-product customers need a deliberate policy. If one company buys two products, decide whether the business reports one customer logo or two product-level subscriptions. Logo retention becomes comparable over time only when the numerator and denominator use the same unit.
Logo Retention Formula
For the SolveIndex model, retained starting logos equal starting logos minus lost logos. Logo retention then divides those retained starting logos by the starting cohort and multiplies by 100.
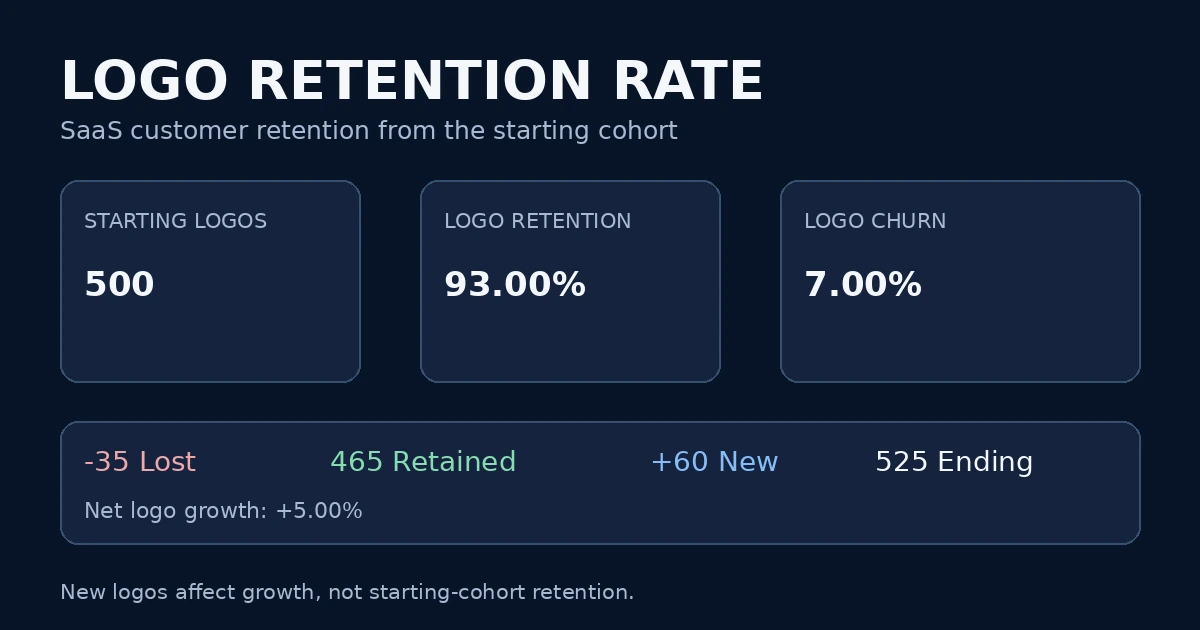
With 500 starting logos and 35 lost logos, 465 starting customers remain. Dividing 465 by 500 gives a 93.00% logo retention rate.
Logo Churn Formula
Logo churn measures the share of the starting customer cohort that was lost during the period. It uses customer accounts rather than recurring revenue dollars.
Using the default example, 35 lost logos divided by 500 starting logos equals 7.00% logo churn. Logo churn should not be confused with revenue churn, where a large customer contributes more weight than a small customer.
Why Retention and Churn Add to 100%
When logo retention and logo churn use the same starting cohort, end date and customer definition, they are mathematical complements. A starting customer either remains retained under your reporting rule or is classified as lost.
This relationship is a useful quality check. If your reported retention and churn do not add to 100%, investigate whether the reports use different cohorts, periods or reactivation policies.
The Starting-Cohort Rule
Retention measures the fate of customers who existed at the beginning of the period. Freeze that cohort first. Then ask which of those same accounts still qualify as paying customers at the end. This prevents acquisition from masking losses.
If a business starts with 500 logos, loses 35 and acquires 60 new customers, retention is still based on the original 500. The 60 new logos are important for growth, but they were never at risk of being retained from the beginning of that period.
Retained vs New Logos
Retained logos come from the starting cohort; new logos were acquired after the period began. Mixing these populations is one of the most common retention mistakes. A company with aggressive acquisition can grow total customer count while still losing a meaningful share of its existing base.
The SolveIndex calculator therefore uses new logos only to calculate ending customer count and net logo growth. It does not add them to the retention numerator.
How to Handle Same-Period Reactivations
Reactivation policies can change the measured result. ChartMogul’s customer-churn methodology adjusts for customers that churn and reactivate within the same measurement period. Other internal reporting systems may record every cancellation event first and reconcile reactivations later.
For a period-end logo-retention view, the cleanest input is usually the number of starting-cohort customers that are no longer paying at period end under your documented policy. Whichever method you choose, apply it consistently across historical periods and benchmarks.
Worked Logo Retention Example
Assume a SaaS company begins the period with 500 paying company accounts. During the period, 35 of those starting accounts are no longer retained, while 60 completely new customer logos are acquired.
| Metric | Example value |
|---|---|
| Starting logos | 500 |
| Lost starting logos | 35 |
| Retained starting logos | 465 |
| Logo retention | 93.00% |
| Logo churn | 7.00% |
| New logos | 60 |
| Ending total logos | 525 |
| Net logo growth | 5.00% |
The example shows why retention and customer-base growth answer different questions. The company retained 93% of its original customers while still expanding its total logo count by 5%.
Ending Logos and Net Logo Growth
Ending logos combine the retained starting cohort with newly acquired customers. Net logo growth compares that ending count with the starting count, so it is a growth metric rather than a retention metric.
In the default scenario, 465 retained logos plus 60 new logos produce 525 ending logos. Compared with 500 starting logos, that is 5.00% net logo growth.
Why New Logos Do Not Raise Retention
Adding new customers to the retention numerator would turn retention into a growth measure and could even push the result above 100%. True logo retention cannot exceed 100% because you cannot retain more starting customers than existed at the beginning of the cohort.
Use acquisition metrics and net logo growth to measure how quickly the customer base is expanding. Use logo retention to measure how successfully the existing customer base is being preserved.
Logo Retention vs User Retention
A B2B customer logo can contain many individual users or seats. Losing one seat from a 100-seat account is not logo churn if the company remains a paying customer. Likewise, a customer can add or remove users while still counting as one retained logo.
User retention is more appropriate when individual users are the economic unit. Logo retention is more appropriate when contracts, renewals and customer success operate at the account or company level.
Logo Retention vs Revenue Retention
Logo retention weights each customer equally. Revenue retention weights customers by recurring revenue. That means the two metrics can move in different directions when account sizes differ.
If ten small customers remain but one very large customer churns, logo retention may still look strong while GRR or NRR deteriorates sharply. Conversely, expansion from retained enterprise customers can support strong NRR even if several smaller logos leave.
Logo Retention vs GRR
Gross Revenue Retention measures recurring revenue retained from the starting customer base before expansion. Logo retention asks whether customers stayed; GRR asks how much starting recurring revenue remained after churn and contraction.
Both metrics exclude new business from the retained starting base, but the weighting differs. Use logo retention to understand customer count durability and GRR to understand downside revenue durability.
Logo Retention vs NRR
Net Revenue Retention includes expansion from retained customers, while logo retention does not have an expansion concept: a logo is either retained or not. NRR can therefore exceed 100%; logo retention cannot.
High NRR with weaker logo retention can occur when expansion from surviving customers more than compensates for lost accounts. Strong logo retention with weak NRR can occur when retained accounts downgrade or large customers leave.
Logo Churn vs Revenue Churn
Logo churn counts the percentage of starting customer accounts lost. Revenue churn measures recurring revenue lost through cancellation and, depending on the definition, contraction. These are related but not interchangeable.
The measured keyword set includes “logo churn vs revenue churn,” and the distinction matters operationally: logo churn highlights account loss frequency, while revenue churn highlights the economic impact of those losses.
Account Size and Revenue Concentration
Revenue concentration explains why logo and revenue retention can diverge. When a few customers account for a large share of MRR or ARR, losing one logo can have a disproportionately large financial impact.
Segment retention by account value, plan, region or sales motion when a blended logo-retention rate hides concentration risk. Pair those segments with GRR or NRR for a fuller view of customer quality.
B2B SaaS Logo Retention
Logo retention is especially common in B2B SaaS because contracts and customer success are organized around company accounts. One enterprise logo may include hundreds of seats, while an SMB logo may include only one or two users.
ChartMogul’s current retention research reports that B2B SaaS generally retains customers better than consumer or AI-native products. That makes company type important when interpreting benchmarks instead of applying one retention target to every SaaS business.
SMB vs Enterprise Retention
Customer size can materially affect retention. Smaller customers may have lower switching costs and less implementation dependency, while enterprise customers can have longer contracts and deeper integrations. However, enterprise losses can create larger revenue shocks.
Compare logo retention within meaningful segments before concluding that a blended company-wide rate is improving or deteriorating. A changing customer mix can move the average even when segment-level behavior is stable.
Monthly vs Annual Measurement
Logo retention can be calculated over monthly, quarterly or annual periods, but the chosen window changes interpretation. Short windows react quickly to recent churn but can be noisy. Annual measurement captures a fuller renewal cycle and reduces seasonality for many subscription businesses.
ChartMogul notes that 12-month customer retention is common even for companies with monthly subscriptions. When comparing benchmarks, confirm that the measurement window is the same.
Renewal Cycles and Contract Terms
Annual contracts can make churn appear clustered around renewal months, while month-to-month products expose customers to cancellation more continuously. Contract terms therefore affect the timing of observed logo churn even when underlying customer satisfaction is similar.
Use cohort or renewal-cycle views when a simple monthly rate produces large seasonal swings. Do not annualize a short-term retention rate mechanically without understanding the cancellation process.
Cohort-Based Retention Analysis
A single blended retention rate can hide whether newer cohorts are improving. Cohort analysis groups customers by acquisition month, quarter or year and follows each starting cohort through comparable ages.
This helps distinguish product improvements from mix changes. For example, a stronger company-wide retention rate may come from more enterprise customers rather than better retention within each customer segment.
Segmenting Logo Retention
Useful segmentation dimensions include plan, ARPA band, geography, acquisition channel, onboarding path, customer size and sales motion. The objective is not to create dozens of unstable metrics; it is to identify groups with meaningfully different churn behavior.
Always keep enough logos in each segment for the rate to be interpretable. A 50% churn rate based on two customers is much less stable than a 10% rate across hundreds of accounts.
Customer Retention Metrics to Pair With Logo Retention
Logo retention is strongest when interpreted beside revenue and growth metrics. Pair it with logo churn, GRR, NRR, revenue churn, ARPA, CAC, LTV and CAC payback depending on the decision being made.
For example, retention explains whether customers stay; ARPA shows their average recurring revenue; NRR shows expansion and contraction; CAC and LTV connect retention quality with acquisition economics.
SaaS Customer Retention Strategies
The Semrush exports show meaningful demand for “SaaS customer retention strategies.” For a logo-retention page, the useful interpretation is operational: improve the probability that a paying customer account remains active through the end of the reporting period.
The highest-leverage actions depend on the cause of churn. Segment cancellation reasons, identify where churn concentrates, and connect retention work to onboarding, product adoption, customer success, support quality, pricing and renewal friction instead of treating retention as a single marketing tactic.
Improve Onboarding and Time to Value
Early churn often indicates that customers did not reach the product’s core value quickly enough. Define the activation events that correlate with long-term retention, then design onboarding to move new accounts toward those events faster.
For higher-touch B2B SaaS, onboarding may include implementation milestones, integrations, training and stakeholder alignment. For self-serve SaaS, in-product guidance and lifecycle messaging may matter more.
Product Adoption and Customer Success
Customer success teams can use adoption signals to prioritize accounts showing declining usage, unresolved support issues or missing key workflows. The goal is not merely to increase activity but to maintain the business outcome that justified the purchase.
Compare logo-retention cohorts before and after major customer-success interventions. This separates genuine retention improvement from anecdotal success stories.
Pricing, Packaging and Downgrade Risk
Pricing changes can affect both logo retention and revenue retention. A customer may remain a retained logo but downgrade to a cheaper plan, which leaves logo retention unchanged while reducing GRR. Alternatively, aggressive repricing can trigger complete logo churn.
Evaluate pricing with both customer-count and revenue-weighted retention so one metric does not hide the trade-off visible in the other.
Support, Reliability and Renewal Friction
Persistent support delays, reliability incidents, billing problems or complicated renewal processes can increase avoidable churn even when the product’s core value is sound. Track operational causes separately from product-fit and budget-related churn.
Closing these friction points often improves retention without changing acquisition strategy. Use cancellation reasons and account-level timelines to identify recurring patterns.
What Is a Good Logo Retention Rate?
There is no universal percentage that is “good” for every SaaS business. Customer type, price point, company stage, contract length and market segment materially affect retention. A consumer subscription and an enterprise infrastructure product should not share the same target.
Use external benchmarks as context, then prioritize your own like-for-like trend and cohort comparisons. A stable definition and improving segment-level retention are more informative than chasing a single industry number.
Benchmark Context and the 85% Reference
ChartMogul’s current benchmark help center reports that companies with customer retention above 85% grow about 1.5-3× faster in its dataset. Treat that as observed benchmark context, not a universal pass/fail threshold.
ChartMogul also reports that retention varies with company type and price point. Use the 85% reference only when the population, period and customer definition are reasonably comparable to your own business.
How to Diagnose a Falling Retention Rate
First verify that the decline is real rather than a reporting change. Check whether the logo definition, cohort dates, reactivation handling or segmentation changed. Then identify which customers and cancellation reasons drive the movement.
Compare logo retention with revenue retention. If both deteriorate, underlying customer health is likely worsening. If logo retention falls while NRR remains strong, expansion from retained customers may be offsetting account losses.
Common Logo Retention Mistakes
Common errors include adding new customers to the retention numerator, mixing users with accounts, changing the logo definition, comparing monthly and annual rates as if they were equivalent, and counting temporary cancellations inconsistently.
Another mistake is reading logo retention as a complete economic metric. Because every account has equal weight, logo retention alone cannot show whether lost customers were economically small or strategically critical.
Practical Logo Retention Reporting Workflow
Start by defining one logo and the reporting period. Snapshot the starting paying-customer cohort, reconcile lost starting logos at period end, document reactivations, then calculate retained logos, retention and churn. Add new logos only after the retention calculation when you want ending-count and net-growth context.
Save both the raw counts and calculated rates. Review trends by cohort and segment, and reconcile logo-retention changes with NRR, GRR and revenue churn before drawing strategic conclusions.
Frequently Asked Questions
Sources and Methodology
The formulas, terminology and benchmark context were cross-checked against the current SaaS measurement sources below. Logo/customer retention is a management metric, so companies should document the counted entity, cohort, period and reactivation policy.
Use the Logo Retention Rate Calculator
Enter starting logos, lost starting-cohort logos and new logos to reproduce the worked scenario and compare retention with customer-base growth.
Open the Logo Retention Rate Calculator