Revenue churn shows how recurring revenue changes inside the customers you already had at the start of a period. This guide explains the revenue churn rate, gross and net revenue churn formulas, MRR churn, negative net churn, cohort rules, and the connections with customer churn, GRR and NRR.
What Revenue Churn Measures
Revenue churn measures how much recurring revenue an existing customer base loses over a defined period. Instead of asking how many customers left, it asks how many recurring-revenue dollars disappeared through cancellations and downgrades. That makes it especially useful in SaaS businesses where account sizes vary and one enterprise cancellation can matter more financially than several small-logo losses.
The denominator should represent recurring revenue from the customers already present at the start of the period. Keeping that cohort fixed prevents new sales from masking retention weakness. For monthly SaaS reporting, starting MRR is usually the cleanest base, while the same logic can be applied to another recurring-revenue period when every movement is measured consistently.
Revenue Churn vs Customer Churn
Customer churn counts lost customers or logos. Revenue churn weights losses by recurring revenue. The two metrics can move very differently when customer sizes differ. Losing ten tiny accounts may create noticeable logo churn but limited revenue churn, while losing one large account can produce the opposite pattern.
Track both measures when possible. Customer churn helps diagnose product adoption and account retention, while revenue churn shows the economic effect of those losses. This page keeps revenue churn as the primary topic; direct customer-churn calculations belong to the separate SaaS Churn Rate calculator and guide.
Starting MRR and the Existing-Customer Cohort
Starting MRR is the recurring revenue attached to the customers active at the beginning of the measurement period. It is the denominator for both gross and net revenue churn in this model. New business acquired during the period should not be added to the denominator or used to offset churn.
Using a fixed starting cohort creates a clean retention view. If the company begins the month with $100,000 of MRR, all churn, contraction and expansion used in the calculation should come from that same customer population. New-customer MRR belongs in growth metrics such as net new MRR, not in revenue churn.
Gross Revenue Churn Formula
Gross revenue churn focuses only on recurring revenue lost from the starting cohort before any expansion is credited. In the SolveIndex calculator, the loss bucket includes both complete cancellation and contraction from customers who remain active at a lower recurring-revenue level.
Formula: Gross Revenue Churn = (Churned MRR + Contraction MRR) ÷ Starting MRR × 100. Because expansion is excluded, gross revenue churn cannot become negative. It is the clearest view of raw revenue erosion and complements gross revenue retention.
Churned MRR
Churned MRR is recurring revenue lost when an existing customer fully cancels the subscription relationship included in the reporting scope. If a customer had $2,000 of MRR at the beginning of the month and cancels completely, that $2,000 belongs in churned MRR.
Do not mix one-time fees, new-customer revenue or unrelated product revenue into the churn amount. Also define how pauses, failed payments and delinquent subscriptions are classified, because analytics platforms can differ on the date at which a customer is considered churned.
Contraction MRR
Contraction MRR is recurring revenue lost when a customer stays but pays less. Common examples include downgrades, removed seats, lower usage commitments, reduced add-ons or partial product cancellation. Treating contraction separately from full churn preserves the distinction between a lost account and a retained account with lower value.
Gross revenue churn normally includes both churned MRR and contraction MRR because both reduce recurring revenue from the starting cohort. If a reporting policy excludes contraction, label the resulting metric clearly so it is not compared with a broader gross-churn definition.
Gross Retained MRR
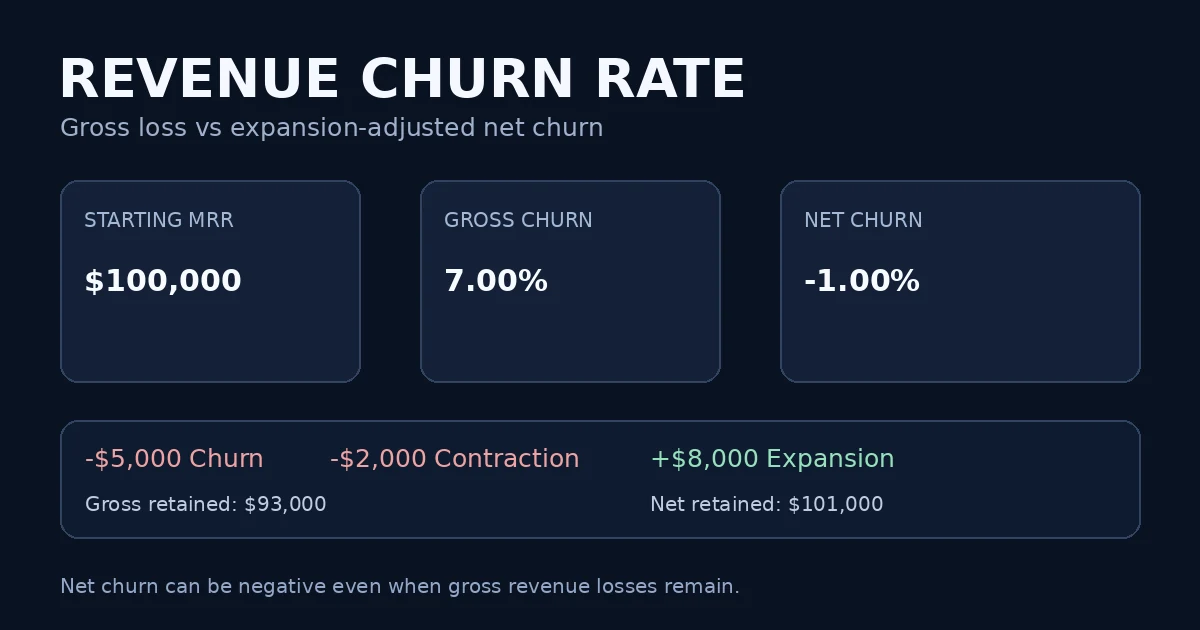
Gross retained MRR converts the gross-churn calculation back into dollars. It equals starting MRR minus churned MRR minus contraction MRR. With $100,000 starting MRR and $7,000 of total losses, gross retained MRR is $93,000.
This dollar bridge is useful when percentages feel abstract. It also makes account-level investigation easier: finance and customer-success teams can trace the $7,000 loss to specific cancellations, downgrades, segments or products before looking at expansion.
Net Revenue Churn Formula
Net revenue churn starts with the same recurring-revenue losses as gross churn but gives credit for expansion from existing customers. Formula in this calculator: Net Revenue Churn = (Churned MRR + Contraction MRR − Expansion MRR) ÷ Starting MRR × 100.
Net churn answers whether the existing customer base is shrinking or growing after upgrades and other expansion. It can fall below zero when expansion exceeds losses. That is why net revenue churn should never replace gross churn: a strong net result can coexist with meaningful cancellations and downgrades.
Expansion MRR
Expansion MRR is recurring revenue gained from customers that were already in the starting cohort. It can come from plan upgrades, additional seats, add-ons, cross-sells, higher usage or other recurring increases. New-customer MRR is not expansion MRR for retention analysis.
Expansion offsets losses in net revenue churn but not in gross revenue churn. This distinction lets teams see both the underlying erosion and the ability of the installed base to grow. Direct expansion analysis belongs to the separate Expansion MRR calculator and guide.
Reactivation MRR and This Calculator’s Scope
Some SaaS analytics systems credit reactivation MRR when calculating net MRR churn or NRR. Reactivation generally means recurring revenue restored when a previously churned customer returns. ChartMogul, for example, can include both expansion and reactivation in its net MRR churn and net retention calculations.
The SolveIndex Revenue Churn Rate calculator currently provides an expansion input but not a separate reactivation input. That is a narrower convention, not a mathematical error. If your internal reporting includes reactivation, document the difference before comparing results across tools or benchmarks.
Negative Net Revenue Churn
Negative net revenue churn occurs when recurring-revenue gains from existing customers exceed churned and contraction MRR. In the default example, losses are $7,000 and expansion is $8,000, so the numerator is negative $1,000 and net revenue churn is -1%.
Negative net churn is economically attractive because the installed base grows without relying on new customer acquisition. Still, it does not mean cancellations disappeared. The same default case has 7% gross revenue churn, so management should understand the underlying losses even when expansion more than offsets them.
Net Retained MRR
Net retained MRR equals starting MRR minus churned MRR minus contraction MRR plus expansion MRR. In the default scenario, $100,000 − $5,000 − $2,000 + $8,000 = $101,000.
When net retained MRR exceeds starting MRR, the existing customer base has expanded on a net basis under the model’s scope. This result can be reconciled directly to net churn: a -1% net churn rate corresponds to 101% net retention when the same components and denominator are used.
Expansion Rate
The calculator also reports expansion MRR divided by starting MRR. In the default case, $8,000 of expansion on $100,000 starting MRR is an 8% expansion rate. This is a useful supporting diagnostic because it separates the positive movement from losses.
Expansion rate by itself is not a retention metric. A business can have strong expansion and still have weak gross retention. Pair it with churn, contraction, GRR and NRR to understand whether growth is broad-based or being carried by a subset of expanding accounts.
Worked Revenue Churn Example
Assume a SaaS company begins the month with $100,000 of MRR from existing customers. During the month it loses $5,000 from cancellations and $2,000 from downgrades, while upgrades and additional usage contribute $8,000 of expansion MRR.
Gross revenue churn is ($5,000 + $2,000) ÷ $100,000 = 7%. Net revenue churn is ($5,000 + $2,000 − $8,000) ÷ $100,000 = -1%. Gross retained MRR is $93,000, net retained MRR is $101,000, and expansion rate is 8%. The example shows why gross and net churn answer different questions.
| Metric | Example value |
|---|---|
| Starting MRR | $100,000 |
| Churned MRR | $5,000 |
| Contraction MRR | $2,000 |
| Expansion MRR | $8,000 |
| Gross revenue churn | 7.00% |
| Net revenue churn | -1.00% |
| Gross retained MRR | $93,000 |
| Net retained MRR | $101,000 |
Why Gross and Net Revenue Churn Differ
Gross churn treats expansion as irrelevant because its purpose is to expose recurring-revenue loss. Net churn deliberately includes expansion because its purpose is to show the net direction of the existing revenue base. Neither is a replacement for the other.
For operating reviews, gross churn helps customer-success and product teams identify leakage, while net churn helps leadership understand whether expansion economics offset that leakage. A dashboard that shows only net churn can hide a serious cancellation problem when upsells are unusually strong.
| Metric | Counts losses? | Counts expansion? | Can exceed/beat 100% equivalent? |
|---|---|---|---|
| Gross revenue churn | Yes | No | No; churn itself cannot be negative |
| Net revenue churn | Yes | Yes | Yes; can be negative |
| GRR | Yes | No | No; capped at 100% |
| NRR | Yes | Yes | Yes; can exceed 100% |
Gross Revenue Churn vs GRR
Gross Revenue Retention (GRR) expresses the share of the starting recurring-revenue base retained after churn and contraction, excluding expansion. Under matching definitions, GRR is the complement of gross revenue churn: GRR = 100% − Gross Revenue Churn.
With 7% gross revenue churn, GRR is 93%. The two metrics communicate the same underlying gross-loss mechanics from opposite directions. Search intent for GRR belongs to the dedicated GRR page; this guide uses the relationship to help reconcile churn reporting.
Net Revenue Churn vs NRR
Net Revenue Retention (NRR) measures recurring revenue retained after losses and qualifying gains from the existing customer base. Under the SolveIndex scope, NRR = 100% − Net Revenue Churn, so -1% net churn corresponds to 101% NRR.
Be careful with reactivation policies. A platform that includes reactivation in NRR but a churn calculation that excludes it will not be exact complements. Align expansion, reactivation, contraction, churn and segment-migration rules before expecting the percentages to reconcile.
Why the 100% Minus Churn Relationship Works
Churn rates describe the portion of starting MRR lost on a gross or net basis, while retention rates describe the portion remaining. When both metrics use the same cohort and movement definitions, they partition the same starting base and therefore add to 100%.
This relationship is a useful data-quality check. If gross churn is 7% but GRR is not 93%, investigate whether one report uses a different period, excludes contraction, includes segment movements differently or uses a different starting MRR population.
Revenue Churn vs Logo Churn
Logo churn is another name for customer or account churn. It weights every lost logo equally, while revenue churn weights customers by recurring revenue. A concentrated enterprise SaaS company can therefore have low logo churn but high revenue churn if one large account cancels.
Use logo churn to understand account retention and revenue churn to understand economic retention. Comparing both by segment often reveals whether churn is concentrated in smaller self-serve accounts or larger strategic customers.
Revenue Churn vs Net New MRR
Revenue churn is a retention metric for the starting existing-customer cohort. Net new MRR is a growth metric that combines new business, expansion and recurring-revenue losses. Adding new-customer MRR to a revenue-churn numerator or denominator changes the question being answered.
If the goal is total MRR growth, use the Net New MRR calculator. If the goal is to understand recurring-revenue erosion and expansion inside existing customers, use revenue churn, GRR and NRR.
Why New-Customer MRR Is Excluded
New customer MRR can make total company revenue grow even when retention is poor. Including it in revenue churn would allow acquisition performance to mask losses from the installed base. That weakens the metric as a diagnostic for customer value and product durability.
The clean approach is to freeze the starting cohort, measure its churn, contraction and expansion, and report new business separately. Leadership can then see whether growth comes from retaining and expanding existing customers, acquiring new ones, or both.
Monthly vs Annual Revenue Churn
Revenue churn can be measured over monthly, quarterly or annual periods, but the inputs must all use the same interval. Monthly MRR churn is common in subscription analytics because recurring-revenue movements can be observed frequently and tied to billing events.
Do not convert a monthly churn percentage to an annual figure by simply multiplying by 12 when a precise compounded interpretation is required. Customer behavior and revenue movement can vary through the year, and different cohorts may have seasonal or contract-renewal patterns.
Cohort Boundaries and Denominator Discipline
A revenue-churn rate is only as reliable as its cohort definition. Starting MRR, churn, contraction and expansion should describe the same population. Segment changes, migrations between plans and customers moving in or out of filters can otherwise create artificial movement.
Document whether reporting is company-wide, by product, plan, geography, customer size or acquisition cohort. When comparing periods, keep the same rules so a metric improvement reflects business performance rather than a denominator change.
Segmented Revenue Churn
Blended churn can hide very different economics across segments. Calculate revenue churn separately for SMB, mid-market and enterprise customers, or by plan, geography, industry and acquisition channel when sample sizes are large enough.
Segmentation helps answer whether losses are broad or concentrated. It also prevents a strong enterprise expansion motion from masking weak self-serve retention, or vice versa. Always preserve the same cohort logic inside each segment.
SMB vs Enterprise Revenue Churn
SMB SaaS often has more customers, lower ARPA and shorter decision cycles, while enterprise SaaS may have fewer, larger contracts and more concentrated renewal risk. That means the same churn percentage can represent very different business exposure.
Enterprise revenue churn can be lumpy because one large customer materially changes the numerator. SMB churn may be more statistically stable but operationally frequent. Benchmark only against companies with reasonably similar customer economics and reporting definitions.
Customer Concentration and Revenue Churn
Revenue churn is sensitive to customer concentration. If a handful of customers represent a large share of MRR, one cancellation or downsell can dominate the period’s churn result. This is not a flaw in the metric; it is useful information about economic dependence.
Pair churn analysis with customer-concentration reporting. A company can have excellent historical revenue churn but still carry renewal risk if too much recurring revenue depends on a small number of accounts.
Downgrades and Contraction Pressure
Contraction deserves its own operating analysis because customers who stay but spend less may be signaling weak adoption, over-provisioned seats, budget pressure or movement to lower-priced plans. A company with low logo churn can still have poor gross revenue retention if contraction is persistent.
Track contraction by reason and segment. Reducing preventable downgrades can improve gross revenue churn even before expansion initiatives are considered.
Revenue Churn Benchmarks: Use Comparable Definitions
Revenue churn benchmarks are highly sensitive to company stage, ARPA, customer segment, contract structure, billing cadence and whether the metric is gross or net. A benchmark is useful only when the comparison population and calculation rules are reasonably similar.
The Semrush data for this topic also shows broader “good churn rate” searches, but those often refer to customer churn rather than revenue churn. This guide therefore avoids presenting one universal revenue-churn target and keeps the focus on definition-consistent comparisons.
What Is a Good Gross Revenue Churn Rate?
For gross revenue churn, lower is generally better because the metric counts only recurring-revenue loss. A company should first compare the rate with its own historical trend and customer segments, then use external benchmarks that match ARPA, business model and period definition.
Gross churn cannot be improved by expansion inside the formula. That makes it a useful guardrail: if gross churn is deteriorating while net churn looks healthy, expansion may be masking a retention problem.
What Is a Good Net Revenue Churn Rate?
Net revenue churn improves as it moves toward zero and can become negative when expansion from existing customers exceeds losses. Negative net churn corresponds to net retention above 100% under matching definitions and indicates that the installed revenue base is growing on a net basis.
Do not use negative net churn as the only retention goal. The best operating picture combines low gross losses with durable expansion, healthy customer retention and consistent segment-level performance.
How to Reduce Gross Revenue Churn
Reducing gross revenue churn starts with preventing cancellations and contraction. Analyze loss reasons, renewal risk, product adoption, support issues, pricing friction, implementation quality, failed payments and downgrade patterns by customer segment.
Prioritize drivers that are both frequent and economically meaningful. Improving onboarding, product value realization, customer success, billing recovery and renewal workflows can reduce revenue leakage, but the right intervention depends on why customers are leaving or spending less.
How to Improve Net Revenue Churn
Net churn improves through the same loss-reduction work that improves gross churn plus sustainable expansion. Upsells, seat growth, cross-sells, usage growth and well-designed packaging can increase recurring revenue from customers who already receive value from the product.
Avoid relying on forced price increases or a few large expansions as a substitute for retention. Durable net-churn improvement comes from keeping customers successful while creating credible paths for their recurring spend to grow.
Common Revenue Churn Mistakes
Common errors include using ending MRR instead of starting MRR, adding new-customer revenue to the cohort, excluding contraction without disclosure, mixing monthly and annual inputs, treating logo churn as revenue churn, and comparing gross churn with another company’s net churn.
Another frequent mistake is ignoring reactivation or segment-migration policy differences between analytics platforms. Write down the exact formula and movement definitions used in every recurring report, then keep them stable over time.
Practical Revenue Churn Reporting Workflow
Start with a fixed reporting period and export starting MRR for the existing-customer cohort. Reconcile churned MRR, contraction MRR and expansion MRR from the same billing or subscription system. Confirm that new business is excluded and that movement classifications match the company policy.
Calculate gross and net churn, then reconcile the dollar bridges to gross and net retained MRR. Review the result by segment, compare with prior periods, and connect the findings with GRR, NRR and customer churn. Investigate large movements at the account level before presenting the metric as a trend.
Revenue Churn Data Checklist
Before publishing the metric, verify five things: the starting cohort is fixed, every movement belongs to the same period, churn and contraction are classified separately, expansion comes only from eligible existing customers, and new-business MRR is excluded.
Frequently Asked Questions
Sources and Methodology
The formulas and scope notes in this guide were cross-checked against current SaaS metrics documentation. Revenue-churn conventions can differ on reactivation, contraction and segment movements, so companies should document their own policy and apply it consistently.
Use the Revenue Churn Rate Calculator
Enter starting MRR, churned MRR, contraction and expansion to calculate gross and net revenue churn for one existing-customer cohort.
Open the Revenue Churn Rate Calculator