Gross revenue retention (GRR), also called gross dollar retention, shows how much recurring revenue a SaaS business keeps from a starting customer cohort after churn and contraction, before expansion. This guide covers the formula, Gross Dollar Retention terminology, GRR vs NRR, benchmark context, and the reporting rules that make comparisons reliable.
What Is Gross Revenue Retention (GRR)?
Gross Revenue Retention (GRR) measures how much recurring revenue a business keeps from a defined starting customer cohort after churn and contraction, before any expansion is allowed to offset those losses. It is a retention metric for the installed revenue base, not a total-company growth rate.
For SaaS reporting, the clean question is: if the company stopped selling new business and received no upsell benefit, how much of the recurring revenue that existed at the beginning of the period would still remain? GRR answers that downside-retention question.
Gross Dollar Retention, GDR and Gross Renewal Rate
Gross Revenue Retention is also commonly called Gross Dollar Retention (GDR). Some analytics teams use Gross Renewal Rate for the same underlying idea. The labels vary, but the measurement should remain tied to retained recurring revenue from the starting cohort with expansion excluded.
When comparing dashboards or benchmark reports, inspect the formula rather than relying on the acronym alone. A source that includes upsells is measuring a net-retention concept even if its internal label sounds similar to gross retention.
What GRR Measures
GRR isolates revenue durability. It captures two ways an existing cohort can shrink: complete churn, where an account cancels, and contraction, where a retained account pays less because of a downgrade, seat reduction, lower usage or other recurring-revenue decrease.
Because expansion is excluded, GRR reveals weakness that a strong upsell motion can hide. A company can report healthy NRR while still losing a meaningful share of its original revenue base. GRR makes that loss visible.
GRR Formula
The standard loss-based formula is GRR = (Starting Recurring Revenue - Churned Revenue - Contraction Revenue) / Starting Recurring Revenue × 100. The numerator is the starting cohort revenue that survives after downside movements only.
The equivalent retained-revenue approach divides end-of-period recurring revenue from the same starting cohort, with expansion stripped out, by the cohort’s starting recurring revenue. Both methods should produce the same result when movement classification is consistent.
Starting Recurring Revenue
Starting recurring revenue is the denominator and should come from the customers in the cohort at the beginning of the period. For a monthly model this is commonly starting MRR; for an annual contract model it can be starting ARR if every other input is also expressed on an ARR basis.
Do not replace the cohort denominator with total company revenue at period end. New customers acquired during the period were not present at the start and therefore do not belong in the GRR calculation.
Churned Revenue
Churned revenue is the recurring revenue lost when customers in the starting cohort fully cancel. If a customer carried $2,000 of MRR at the start and leaves completely, that $2,000 is churned MRR for the cohort.
Use recurring revenue rather than invoices, cash receipts or one-time fees. A cancellation can create accounting and cash effects outside the recurring-revenue measure, but GRR should stay on the same recurring basis as its denominator.
Contraction and Downgrade Revenue
Contraction is recurring revenue lost while the customer remains active. Examples include moving to a lower plan, removing seats, reducing committed usage or eliminating a recurring add-on. These movements reduce GRR even though the customer logo is retained.
Separating contraction from full churn is useful operationally. Churn points to complete account loss, while contraction may signal pricing pressure, over-provisioned plans, budget cuts or declining product adoption.
Why Expansion Is Excluded from GRR
Expansion revenue from upgrades, added seats, cross-sells or higher usage is intentionally excluded. GRR is designed to show how much starting revenue survives without assistance from upselling.
This exclusion is what caps GRR at 100%. If an account expands enough to offset another customer’s loss, NRR can reward that expansion; GRR still records the underlying loss and therefore preserves a cleaner view of downside retention.
Why Reactivation Is Excluded
Current ChartMogul methodology also excludes reactivation from gross MRR retention. Reactivated revenue is a positive movement, so crediting it would weaken the downside-only purpose of GRR.
Companies should document their reactivation policy because billing systems classify returning customers differently. For cross-company comparisons, confirm whether reactivation is excluded from GRR and included only in net-retention reporting.
Why New Customer Revenue Is Excluded
New-business revenue is outside the starting cohort and therefore does not belong in GRR. Including it would mix acquisition performance with retention performance and could push the result above 100%, which violates the standard gross-retention definition.
Use MRR growth or Net New MRR to evaluate revenue added through acquisition. GRR should remain focused on preserving recurring revenue that already existed at the beginning of the measurement window.
Retained Recurring Revenue
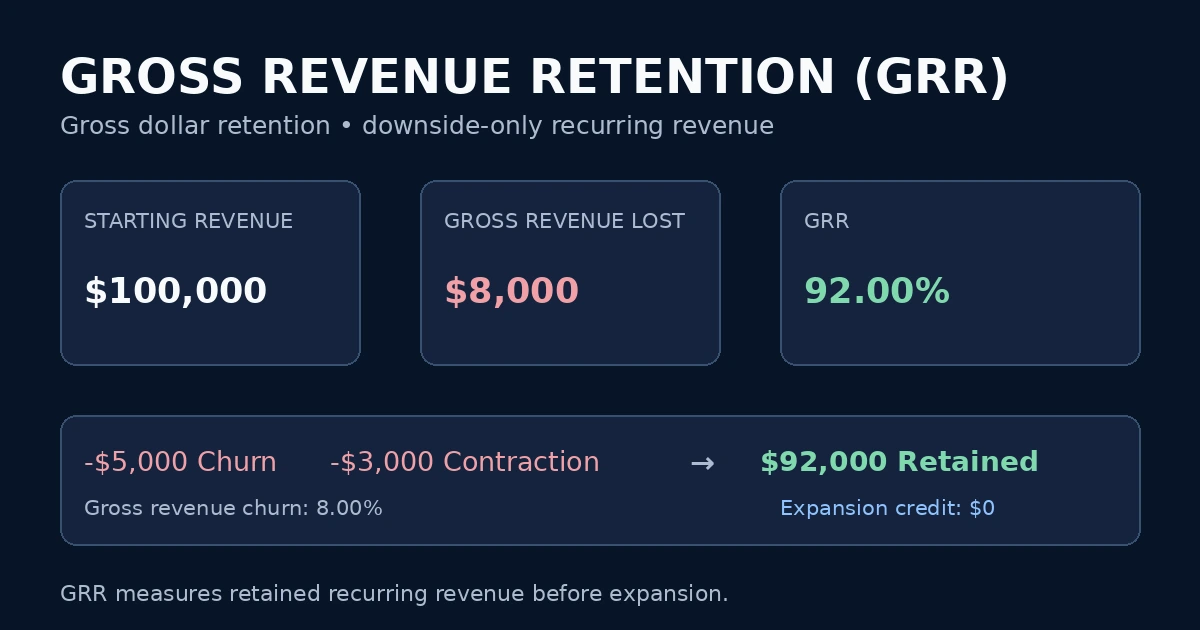
Retained recurring revenue equals starting recurring revenue minus churn and contraction. In the calculator’s default example, $100,000 of starting revenue minus $5,000 of churn and $3,000 of contraction leaves $92,000 retained.
This retained value is the economic base behind the percentage. Tracking both dollars and the GRR percentage helps distinguish a rate change from a change in the size of the starting cohort.
Gross Revenue Lost
Gross revenue lost is simply churn plus contraction. It shows the recurring dollars that disappeared from the starting cohort before expansion is considered.
The dollar loss is often more actionable than the percentage alone because teams can decompose it by cancellation reason, downgrade reason, plan, customer size, industry, region or acquisition cohort.
GRR and Gross Revenue Churn
With the same cohort and revenue definition, Gross Revenue Churn = 100% - GRR. A 92% GRR therefore corresponds to 8% gross revenue churn.
The two metrics express the same downside movement from opposite directions: GRR shows what remained and gross revenue churn shows what was lost. Direct revenue-churn search intent belongs to the dedicated Revenue Churn guide, while this guide uses the relationship to interpret GRR.
Can GRR Exceed 100%?
No under the standard definition. GRR never adds expansion, reactivation or new-business revenue to the starting cohort, so 100% is the mathematical ceiling.
A reported gross retention rate above 100% is usually a signal that the implementation includes a positive revenue movement or uses a nonstandard denominator. Inspect the movement rules before comparing it with conventional SaaS GRR benchmarks.
Worked GRR Example
Start with $100,000 of recurring revenue. During the period, customers that fully cancel remove $5,000 and downgrades remove another $3,000. Total gross revenue lost is $8,000 and retained recurring revenue is $92,000.
Dividing $92,000 by $100,000 gives 92.00% GRR. The same example produces 8.00% gross revenue churn. Any upsell revenue generated by retained customers is deliberately ignored in this calculation.
| Metric | Example value |
|---|---|
| Starting recurring revenue | $100,000 |
| Churned revenue | $5,000 |
| Contraction revenue | $3,000 |
| Gross revenue lost | $8,000 |
| Retained recurring revenue | $92,000 |
| GRR | 92.00% |
| Gross revenue churn | 8.00% |
GRR vs NRR
GRR measures retained recurring revenue before expansion. Net Revenue Retention (NRR) adds expansion and typically reactivation to the same starting-customer revenue base, so NRR can exceed 100% while GRR cannot.
The difference between NRR and GRR is strategically useful. A wide positive gap indicates expansion is doing significant work. If GRR is weak but NRR is strong, management should still investigate the churn and contraction hidden beneath that expansion.
GRR vs Net Dollar Retention
Net Dollar Retention (NDR) is a common synonym for NRR, just as Gross Dollar Retention is a synonym for GRR. Gross dollar retention excludes positive expansion; net dollar retention includes it.
When investors or benchmark reports use GDR and NDR instead of GRR and NRR, the comparison is still gross versus net retention as long as the movement definitions and cohort period are aligned.
GRR vs Logo Retention
Logo retention counts customer accounts equally. GRR weights those accounts by recurring revenue. Losing one large enterprise account can therefore hurt GRR much more than logo retention.
Reporting both metrics helps separate breadth of customer retention from economic retention. Strong logo retention with weak GRR can signal that the company is retaining smaller accounts while losing or downsizing larger ones.
GRR vs Customer Churn
Customer churn measures the percentage of starting accounts that leave. GRR measures recurring revenue retained after full cancellations and partial contractions. A downgrade affects GRR without causing customer churn.
This difference matters in seat-based and usage-based SaaS, where customers can remain active while materially reducing spend. Customer-count retention alone may miss that deterioration.
GRR vs Revenue Churn
Gross revenue churn is the loss-side complement of GRR under aligned definitions. Net revenue churn is different because it subtracts expansion from losses and can become negative.
Use the Revenue Churn Rate guide for gross-versus-net churn methodology. Use GRR when the primary question is the percentage of starting recurring revenue that remains before expansion.
MRR vs ARR Basis
GRR can be calculated with MRR or ARR as long as all values use the same basis. Monthly reporting commonly starts with MRR, while annual-contract businesses may prefer ARR for an annual retention view.
Do not divide annual churned ARR by monthly starting MRR or mix recognized revenue with recurring run-rate measures. Unit inconsistency can distort the result more than small arithmetic differences.
Monthly, Quarterly and Annual GRR
Retention can be measured over different windows, but the rate changes with the window. A monthly GRR should not be compared directly with an annual GRR because a longer period gives more time for churn and contraction to occur.
For board and benchmark reporting, annual or trailing-twelve-month retention is common. For operating teams, monthly cohort views can surface deterioration earlier. Label the period every time the metric is reported.
Cohort Alignment and Period Consistency
Freeze the starting customer cohort first. Then attribute churn and contraction only to that cohort during the selected period. Customers acquired later should not enter the denominator or numerator.
Consistent cohort boundaries make period-over-period trend analysis meaningful. A changing population can create an apparent improvement or deterioration that is caused by methodology rather than actual retention behavior.
Segmenting GRR
Company-wide GRR is useful, but segment GRR often explains why the total moved. Break retention down by plan, customer size, industry, region, acquisition channel, contract type or tenure when enough data is available.
A blended 90% GRR can hide one segment at 98% and another at 70%. Segment analysis helps prioritize customer-success, product and pricing work where the revenue leakage is concentrated.
SMB vs Enterprise GRR
Enterprise SaaS often has larger contracts, longer commitments and higher switching costs, while SMB products can experience more frequent customer turnover. These structural differences affect reasonable GRR expectations.
Benchmarking should therefore use a comparable customer profile rather than a single cross-market target. A retention rate that is strong for a low-ARPA self-serve product may be weak for enterprise infrastructure software.
ARPA, ACV and GRR Context
ARPA and ACV influence how retention should be interpreted because pricing level usually correlates with contract length, implementation depth and customer-success intensity. Higher-value accounts often receive more retention resources.
Current ChartMogul guidance explicitly recommends keeping ARPA in mind when judging GRR. Use your own price band and contract model when selecting peers.
Customer Concentration and GRR
GRR is revenue-weighted, so a small number of large customers can dominate the result. One large cancellation may reduce GRR sharply even when most logos remain.
If concentration is high, pair GRR with account-level movement tables and logo retention. This shows whether the decline comes from broad-based weakness or a small number of economically significant accounts.
Pricing, Downgrades and Contraction
Pricing and packaging changes can improve or hurt GRR. If customers regularly downgrade because plans are oversized or value is unclear, contraction becomes a persistent drag even without full cancellations.
Track downgrade reasons separately from churn reasons. Packaging, seat minimums, usage limits and discount expirations can all change contraction behavior without changing the number of customers retained.
Usage-Based and Hybrid SaaS
Usage-based businesses need a documented rule for distinguishing normal usage fluctuation from true contraction. A temporary seasonal decline may not represent the same retention problem as a permanent reduction in committed spend.
For hybrid pricing, consider separating committed subscription revenue from variable usage before benchmarking. Consistency matters more than forcing every pricing model into one generic movement taxonomy.
2026 GRR Benchmark Context
SaaS Capital’s 2026 survey of more than 1,000 private B2B SaaS companies reports a median GRR of 91% for bootstrapped companies with $3M-$20M in ARR, while the 90th percentile reached 100%. This is a specific population, not a universal target.
ChartMogul’s current GRR guidance also shows that retention varies materially with ARPA. Treat external benchmarks as context only after matching company type, price point, scale, period and metric definition.
What Is a Good Gross Revenue Retention Rate?
A good GRR is one that is strong relative to a comparable business and improving or stable under a consistent definition. Higher GRR means less of the starting revenue base must be replaced through new acquisition or expansion.
Do not treat 91%, 95% or any other percentage as a universal pass/fail line. A useful target should reflect your segment economics, contract structure and historical trend while remaining grounded in comparable benchmarks.
How to Improve GRR
Improving GRR means reducing full churn and contraction. Common levers include faster onboarding, stronger time-to-value, proactive customer success, better product reliability, clearer packaging, renewal-risk detection and resolving recurring support friction.
Measure improvements by cohort rather than relying only on anecdotes. Compare retention before and after an intervention while controlling for customer size, tenure and plan mix when possible.
How to Diagnose a Falling GRR
First confirm the decline is not caused by a reporting change. Check cohort dates, revenue basis, movement classifications and whether expansion or reactivation accidentally entered the gross calculation.
Then decompose gross revenue lost into cancellations and contraction, identify the accounts responsible, and compare the movement with logo retention and NRR. This sequence separates methodological issues from true customer-health problems.
Common GRR Mistakes
Common mistakes include adding expansion, including new-customer revenue, mixing MRR and ARR, comparing different measurement windows, ignoring contraction, changing the starting cohort, and treating reactivation as retained gross revenue.
Another mistake is using GRR as a standalone growth metric. It measures protection of the existing revenue base. New business, expansion, profitability and cash efficiency require separate metrics.
Practical GRR Reporting Workflow
Define the reporting period and recurring-revenue basis, snapshot starting customers and revenue, classify churn and contraction, exclude positive movements, then calculate retained revenue, GRR and gross revenue churn. Store the raw movement values beside the percentage.
Review the result against prior periods and comparable segments. Pair GRR with NRR and logo retention, investigate material changes, and keep the written methodology stable so future comparisons remain valid.
Frequently Asked Questions
Sources and Methodology
The formula, terminology and 2026 benchmark context in this guide were cross-checked against current SaaS measurement sources. GRR is a management metric, so companies should document the cohort, recurring-revenue basis, period and movement-classification rules used internally.
Use the Gross Revenue Retention (GRR) Calculator
Enter starting recurring revenue, churned revenue and contraction revenue to reproduce the 92% GRR example and test alternative downside-retention scenarios.
Open the GRR Calculator