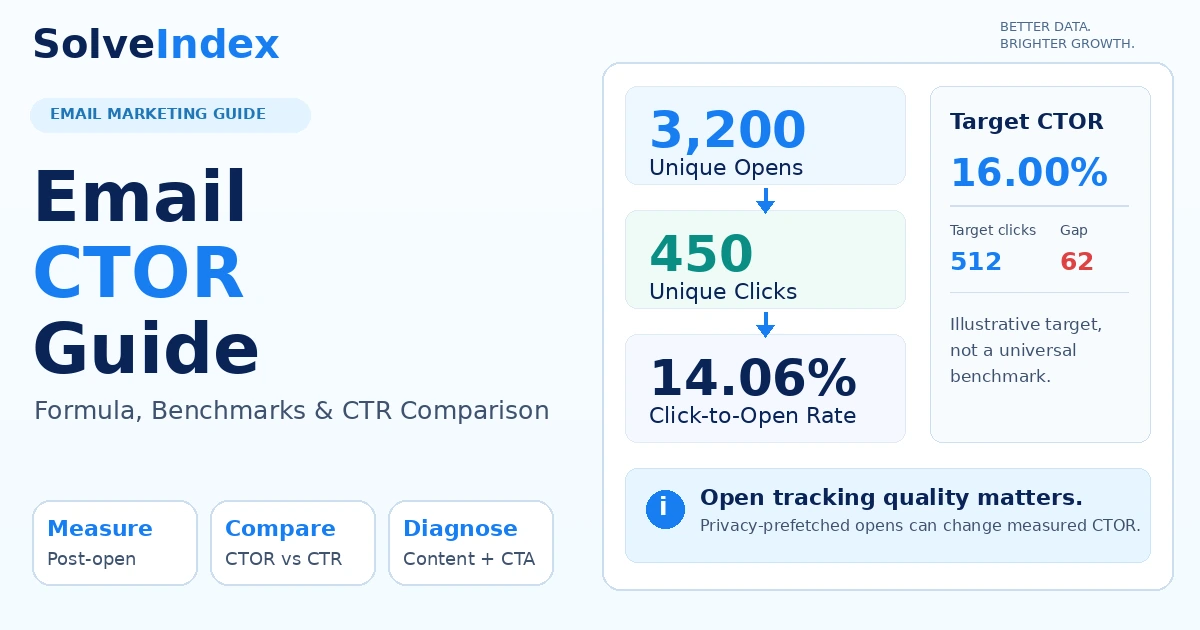
Email CTOR answers a focused question: among recipients recorded as opening an email, how many became unique clickers? Use it to diagnose post-open engagement, but keep CTR, conversion quality and open-tracking limitations in view.
What Is Email CTOR (Click-to-Open Rate)?
Email click-to-open rate, usually shortened to CTOR, measures the share of recorded unique email openers who also became unique clickers. It narrows the analysis to people who reached the open stage, which makes it useful for diagnosing whether the email body, offer, links and call to action were compelling enough to generate a click.
CTOR is not the same as overall email click-through rate. CTR normally asks how many delivered recipients clicked, while CTOR asks how many recorded openers clicked. That denominator difference is the central idea behind the metric and the main reason the two rates can move differently.
Email CTOR Formula
Click-to-open rate formulas
CTOR = Unique Clicks / Unique Opens x 100Openers Without a Click = Unique Opens - Unique ClicksTarget Clicks = Unique Opens x Target CTORThe SolveIndex calculator uses unique recipient counts so one person who opens or clicks repeatedly does not automatically inflate the numerator or denominator. MailerLite describes CTOR with the same unique-clicks divided by unique-opens approach, while Mailchimp reports a closely equivalent metric as clicks per unique opens.
How to Calculate Click-to-Open Rate
Start with unique opens and unique clicks from the same email, audience scope and reporting window. Divide unique clicks by unique opens, then multiply by 100. If 450 unique recipients clicked after 3,200 unique recipients were recorded as opening, the calculation is 450 ÷ 3,200 × 100 = 14.0625%, usually displayed as 14.06%.
When your platform already reports CTOR or clicks per unique opens, the manual formula is still useful for auditing definitions. Check whether both figures are unique recipient counts and whether bot filtering, privacy filtering or attribution settings differ across the reports you are comparing.
Why Unique Opens and Unique Clicks Matter
Unique opens count recipients rather than every open event, and unique clicks count recipients rather than every click event. Klaviyo explicitly distinguishes unique opens and clicks from total events: one recipient opening twice still counts as one unique open, and one recipient clicking twice still counts as one unique click.
Mixing total opens with unique clicks changes the meaning of CTOR and usually pushes the rate downward because repeated opens enlarge the denominator. Mixing total clicks with unique opens can push the rate upward and may even create results above 100%. For recipient-level CTOR, keep both sides unique.
Worked CTOR Example: 3,200 Opens and 450 Clicks
With 3,200 unique opens and 450 unique clicks, CTOR is 14.06%. The same data implies 2,750 recorded openers who did not become unique clickers. Expressed another way, there were about 14.06 unique clickers for every 100 recorded unique openers.
The calculator also accepts an optional target. At a 16% planning target, 3,200 opens would imply 512 unique clicks. Compared with the observed 450, the gap is 62 clicks. This target is an example planning reference, not a claim that every sender should achieve 16%.
How to Use a Target CTOR
A target is most useful when it comes from your own comparable history: similar audience, campaign purpose, send type, tracking setup and season. A newsletter, promotional blast, onboarding email and transactional-style lifecycle message can produce very different click behavior, so one target should not be applied blindly across all sends.
Use the target as a diagnostic threshold rather than a pass-or-fail grade. If CTOR is below target, investigate content and measurement conditions. If it is above target, confirm that the clicks are meaningful and that downstream conversions or revenue quality did not deteriorate.
Clicks per 100 Unique Opens
CTOR is already a percentage, so it can be read as clickers per 100 recorded openers. A 14.06% CTOR means roughly 14.06 unique clickers for every 100 unique openers. This framing is useful when stakeholders find ratios easier to interpret than formulas.
It does not mean each opener clicked 0.1406 times, and it does not describe total clicks. One recipient may click several links while still counting as one unique clicker in the recipient-level model.
What Is a Good Email CTOR?
There is no universal good click-to-open rate that applies to every list, industry, campaign type and tracking environment. A useful comparison hierarchy is: your own comparable history first, then a relevant campaign cohort, then a provider benchmark used only as context.
This matters because CTOR depends on both click behavior and recorded opens. A change in open tracking can move CTOR even when human clicking behavior is unchanged. A sender with a lower reported CTOR can still have stronger business outcomes if click quality and conversions are higher.
2026 CTOR Benchmark Context
MailerLite’s current 2026 benchmark report analyzes more than 3.6 million campaigns from 181,000 approved accounts, covering December 2024 through November 2025. It reports a median click-to-open rate of 6.81% across all industries. That is a provider-specific dataset and should be treated as context, not a universal target.
The same report notes that Apple Mail Privacy Protection inflates recorded opens and therefore can depress measured CTOR. This is one reason a benchmark should not override your own consistent historical baseline.
Click-to-Open Rate by Industry
In MailerLite’s dataset, industry CTOR values ranged from 2.96% to 14.82%. Examples include marketing and advertising at 6.09%, ecommerce at 4.01%, business and finance at 7.96%, software and web apps at 5.40%, and manufacturing at 14.82%.
These figures show why a single cross-industry target can mislead. Industry mix is only one factor; audience intent, offer type, campaign purpose, list age, device mix and tracking methodology can all shift the observed rate.
Regional CTOR Context
MailerLite’s 2026 benchmark report also shows regional differences. The reported median was 6.73% for the US and Canada, 8.30% for Australia and 6.46% for Europe. The report does not provide a separate UK figure in the regional table, so Europe should not be silently presented as a UK-specific benchmark.
Regional benchmarks are useful for orientation, but they still combine many industries and campaign types. Compare them only after confirming that your measurement definition is similar.
CTOR vs CTR: What Is the Difference?
CTR and CTOR share clicks in the numerator but use different denominators. Email CTR typically divides unique clickers by delivered emails. CTOR divides unique clickers by unique opens. In the Semrush exports supplied for this page, “ctr vs ctor” is one of the strongest directly relevant comparison queries, so the distinction deserves explicit treatment.
A campaign can have a low CTR but a strong CTOR if only a small share of delivered recipients open while the people who do open are highly engaged. The reverse can happen when many people open but relatively few click. Looking at both helps separate inbox/open-stage performance from post-open content performance.
Click Rate vs Click-to-Open Rate
Email platforms often label delivered-recipient clicking as click rate or click-through rate, while CTOR may appear as click-to-open rate or clicks per unique opens. Always inspect the platform definition rather than relying on the label alone.
Mailchimp, for example, defines email click rate as the percentage of delivered emails that registered at least one click and separately defines clicks per unique opens as the percentage of recipients who opened and then clicked. Those two fields answer different questions.
CTOR vs Open Rate
Open rate measures the share of delivered recipients recorded as opening. CTOR starts after that stage and measures clicking among recorded openers. A weak open rate with a strong CTOR may point toward subject-line, sender-name, inbox-placement or audience-timing issues rather than weak body content.
A strong open rate with weak CTOR can suggest that the promise made before the open is not translating into relevant content or a clear next action. Because open measurement is imperfect, avoid treating either metric as a complete diagnosis by itself.
CTOR vs Email Conversion Rate
CTOR stops at the click. Conversion rate asks whether recipients completed the action that matters after the click, such as a purchase, registration, demo request or download. A higher CTOR is not automatically better if the extra clicks are low intent.
Use CTOR to diagnose email content engagement, then use conversion rate to test whether those clicks create meaningful outcomes. If CTOR rises while conversion quality falls, investigate message-to-landing-page alignment, offer clarity and audience intent.
CTOR vs Email Marketing ROI
Email marketing ROI is a financial efficiency metric based on return relative to cost. CTOR is an engagement metric. Strong CTOR can support ROI by sending more qualified traffic to a destination, but it does not measure revenue, margin, campaign cost or incremental profit.
Treat CTOR as one stage in the funnel rather than the final business outcome. The SolveIndex email marketing ROI calculator and guide should own ROI intent so this CTOR page stays focused.
Keep Opens and Clicks in the Same Scope
Both numbers should come from the same campaign or comparable reporting unit. Do not divide clicks from a seven-day window by opens from a thirty-day window, combine one variant’s clicks with an entire A/B test’s opens, or mix flow-level clicks with campaign-level opens.
Provider, timezone, bot-filter settings and unique-versus-total rules should also be consistent. A measurement change can look like a performance change when the underlying audience behavior is actually stable.
Open-Tracking Limitations Also Affect CTOR
Open tracking commonly relies on a small tracking image. Blocking, prefetching, caching and privacy features can affect whether an open is recorded. Because unique opens are CTOR’s denominator, any systematic change in open measurement can change CTOR even if the number of human clickers stays constant.
This is why CTOR is best used as a comparative platform metric under a stable measurement setup. For broader campaign evaluation, pair it with delivered-recipient click rate and downstream conversion metrics that do not depend on recorded opens.
How Apple Mail Privacy Protection Affects CTOR
Apple Mail Privacy Protection can prefetch remote email content. Klaviyo explains that this can create Apple Privacy Opens even when the recipient did not actually open the message, and that it cannot distinguish a true human open from an automated MPP open in those cases.
When the denominator is inflated by automated opens and unique clicks do not rise proportionally, measured CTOR falls. If your provider offers MPP filtering or separate Apple Privacy Open reporting, use a consistent setting when comparing campaigns over time.
Bot Clicks and Security Scanners
Click data can also be affected by automated security scanners or bot activity. Some email platforms provide bot filtering or separate reporting options. If automated clicks enter the numerator while your open denominator follows different filtering rules, CTOR can be distorted in the opposite direction.
Document whether bot filtering is enabled and avoid comparing a filtered report with an unfiltered historical series. The goal is measurement consistency, not simply choosing the configuration that makes the rate look higher.
Using CTOR to Diagnose Email Content
When open rate is relatively stable and CTOR declines, the problem is more likely to be after the open. Review whether the email delivers on the subject-line promise, whether the main benefit appears early enough, whether the offer matches the audience segment and whether the reader has a clear reason to click.
CTOR is especially useful for comparing content variants when the open denominator is reasonably comparable. It is less useful when one variant’s opens are heavily distorted by a different audience, send time or privacy-client mix.
Call-to-Action Clarity and CTOR
A strong call to action tells the reader what happens next and why the click is worthwhile. Vague buttons, competing primary actions or repeated links with different promises can reduce decision clarity even when the email itself is interesting.
For a low CTOR, test the CTA copy, prominence, surrounding value proposition and visual hierarchy. Do not optimize for clicks that misrepresent the destination; click quality and conversion behavior still matter.
Link Placement, Number of Links and Click Intent
Links near the main value proposition can make the next step obvious, while burying the only meaningful link at the end of a long message may reduce clicks. Too many unrelated links can also fragment attention.
Test placement in comparable sends rather than assuming one universal layout. A newsletter designed for browsing may legitimately contain many links, while a focused promotional email may perform better with one dominant action.
Mobile Layout and Clickability
An email can earn an open and still lose the click because buttons are difficult to tap, text is cramped or the primary action appears too far down the message. Review the message on common mobile widths and confirm that touch targets, spacing and hierarchy are usable.
Mobile improvements should be judged with click and conversion data, not CTOR alone. A more prominent button that generates accidental or low-quality clicks is not necessarily an improvement.
Segmentation and Message Relevance
Segmentation can improve the match between audience intent and email content. Instead of sending the same offer to every subscriber, group recipients using meaningful attributes such as lifecycle stage, product interest, prior behavior or signup source when those signals are available and appropriate.
If CTOR differs sharply by segment, that can reveal where the content is resonating. Compare like with like: a highly engaged customer segment should not become the benchmark for a cold or re-engagement audience.
Compare CTOR by Campaign Type
Promotional campaigns, editorial newsletters, product announcements, onboarding emails and lifecycle automations create different reasons to click. Pooling them into one average can hide useful patterns.
Build cohorts by campaign purpose and track median or typical CTOR over time. Then investigate changes within the same cohort before making broad conclusions about overall email quality.
Newsletter Click-to-Open Rate
For newsletters, CTOR can help assess whether the stories, resources or offers inside the message attract action from people who were interested enough to open. Because newsletters often include several links, also review link-level click distribution to understand which topics drive engagement.
A newsletter with modest overall CTOR can still be valuable if readers consume content without clicking or if a small number of high-intent clicks drives the desired outcome. Use the metric in context.
CTOR for Automated Flows
Automated flows such as welcome, onboarding, browse or post-purchase sequences may have different audience intent from scheduled campaigns. Analyze each message position separately before averaging the entire flow.
If a later flow email has lower CTOR, that can reflect changing recipient intent, not necessarily worse creative. Compare message purpose, eligibility rules and timing before deciding what to change.
Single-Send CTOR vs Trend Analysis
A single campaign can be noisy because of topic, audience composition, seasonality or tracking conditions. A rolling series of comparable sends is more useful for identifying sustained changes.
Track CTOR alongside open rate, delivered-recipient click rate and conversion rate. If all click-related metrics decline together, engagement likely changed. If CTOR moves while CTR and conversions are stable, investigate the open denominator and tracking environment.
A/B Testing With CTOR
CTOR can be a useful secondary metric in content-focused A/B tests when both variants have similar open conditions. Test one meaningful variable at a time where practical, such as CTA wording, content order or offer presentation, and make sure the sample is large enough for the observed difference to matter.
Do not choose a winner solely because CTOR is numerically higher. Check the primary business outcome and confirm that the variant did not trade away conversions, revenue quality or subscriber satisfaction.
Why Is My Email CTOR Low?
Common causes include weak message-to-audience fit, unclear calls to action, poor link visibility, mobile usability problems, too many competing actions, misleading subject-line expectations or an offer that does not justify a click. Measurement issues such as inflated opens can also push the reported rate down.
Start with the funnel: verify tracking, compare CTR and open rate, inspect link-level clicks, then review content. This sequence helps avoid rewriting the email when the real issue is measurement or audience selection.
Is a High CTOR Always Good?
No. A high CTOR is encouraging when clicks are intentional and lead to useful downstream behavior, but it can coexist with low open volume, low conversions or a very small sample. It can also be distorted by automated clicks.
Ask whether the campaign reached enough qualified recipients, whether clicks converted, and whether the metric is stable across similar sends. A strong rate on ten recorded opens is less informative than a stable pattern across a meaningful volume.
Common CTOR Reporting Mistakes
- Calling CTOR and CTR the same metric.
- Using total opens with unique clicks.
- Mixing campaigns, variants or reporting windows.
- Treating a provider benchmark as a universal target.
- Ignoring Apple MPP or bot-click effects.
- Optimizing CTOR while ignoring conversion quality.
- Comparing campaign types with very different intent.
Practical CTOR Monitoring Workflow
- Confirm the campaign, audience and reporting window.
- Collect unique opens and unique clicks under the same provider settings.
- Calculate CTOR and compare it with your own comparable history.
- Review CTR to separate delivered-recipient performance from post-open engagement.
- Check conversion quality after the click.
- Investigate MPP and bot filtering when the movement looks inconsistent.
- Segment by campaign type or audience before drawing conclusions.
- Test one meaningful content change and measure the next comparable sends.
Frequently Asked Questions
Sources and Methodology
SolveIndex cross-checked CTOR definitions and reporting behavior against Mailchimp custom report metrics, Klaviyo unique vs. total opens and clicks, and Klaviyo Apple MPP reporting guidance. Current benchmark context comes from MailerLite's 2026 email marketing benchmark report, based on more than 3.6 million campaigns from December 2024 through November 2025.
Benchmarks are presented as provider-specific context, not universal targets. Reviewed September 19, 2026. The calculator does not connect to an email service provider or analytics account; it calculates only from the values entered by the user.
Use the Email CTOR Calculator
Enter unique opens, unique clicks and an optional target to calculate CTOR, openers without a click, clicks per 100 opens, target clicks and the click gap.
Open the Email CTOR Calculator