Email unsubscribe rate measures how often delivered recipients choose to leave future marketing. It is a useful negative-engagement signal, but the number only becomes actionable when you keep the denominator consistent, compare similar send types and investigate why subscribers opted out.
What Email Unsubscribe Rate Measures
Email unsubscribe rate is the percentage of successfully delivered recipients who unsubscribe from future marketing after an email. In practical reporting, it helps answer a narrow but important question: out of the people who actually received the message, how many chose to stop receiving marketing from the sender?
An unsubscribe is a negative-engagement event, but it is not identical to a bounce, spam complaint, low open rate or low conversion rate. Each metric describes a different stage of the email funnel. Unsubscribe rate is most useful when you trend it alongside those neighboring metrics rather than treating it as a standalone score.
Email Unsubscribe Rate Formula
Unsubscribe formulas
Unsubscribe Rate = Unique Unsubscribes / Delivered Emails x 100Unsubscribes per 1,000 = Unique Unsubscribes / Delivered Emails x 1,000Target Unsubscribes = Delivered Emails x Target RateKlaviyo currently defines email unsubscribe rate as the number of people who unsubscribe after receiving an email divided by the number of emails received. Its deliverability documentation also describes the denominator as total emails delivered. SolveIndex uses that delivered-recipient model so bounced messages do not inflate the base.
Why Delivered Emails Are the Denominator
A recipient must receive the email before the campaign can reasonably be credited with an unsubscribe. That is why delivered emails are a cleaner denominator than attempted sends. If 10,000 messages were attempted but 200 bounced, the engagement audience is closer to 9,800 delivered recipients, not all 10,000 attempts.
Platform dashboards can label recipient, received and delivered counts differently. The safest comparison rule is to keep the same provider, denominator definition and reporting scope over time. A change in measurement method can look like a performance change even when subscriber behavior is unchanged.
Unique Unsubscribes vs Unsubscribe Events
For a recipient-level rate, use unique unsubscribers rather than raw event counts. If one person triggers more than one unsubscribe-related event, counting every event can overstate the share of recipients who opted out. Your ESP may already deduplicate this metric, but confirm the definition before comparing exports from different systems.
Worked Email Unsubscribe Rate Example
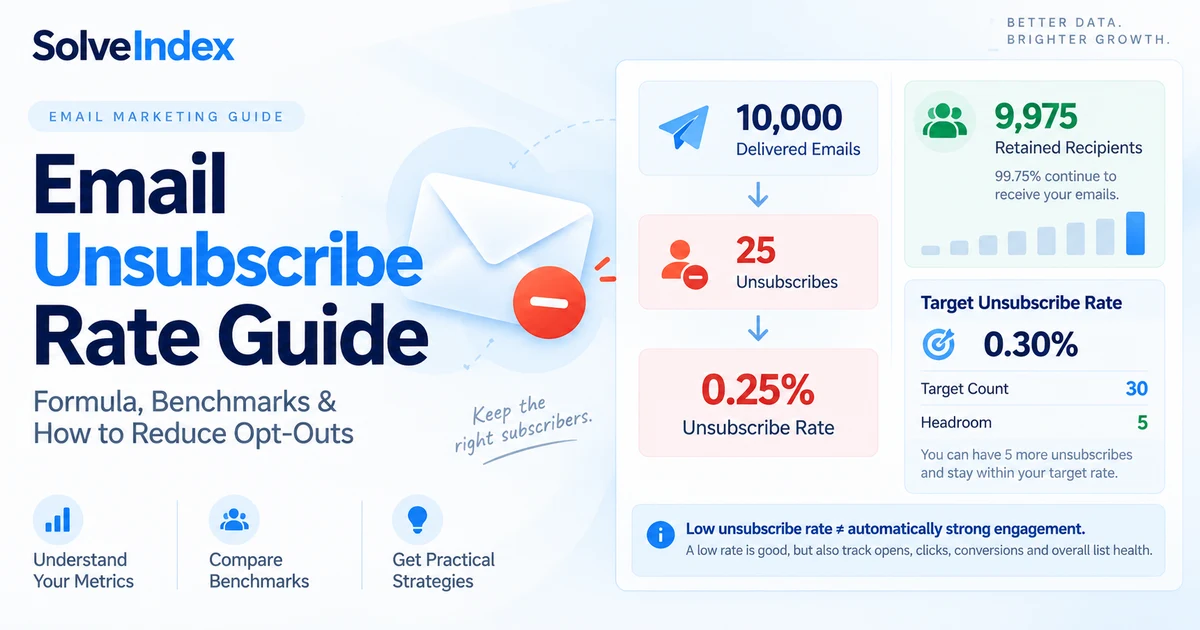
Suppose a campaign delivers 10,000 emails and 25 unique recipients unsubscribe. The rate is 25 divided by 10,000, or 0.25%. That also equals 2.5 unsubscribes per 1,000 delivered recipients. The remaining 9,975 delivered recipients did not unsubscribe from that send.
If your monitoring target is 0.30%, that same 10,000-recipient delivery volume corresponds to 30 unsubscribes. The current campaign therefore has headroom of five unsubscribes before reaching the entered threshold. Headroom is a planning comparison, not permission to intentionally generate more unsubscribes.
Unsubscribes per 1,000 Delivered
Percentages can feel abstract when rates are small. Converting the result to unsubscribes per 1,000 delivered recipients makes changes easier to communicate. A 0.25% rate equals 2.5 unsubscribes per 1,000. A 0.50% rate equals 5 per 1,000. The underlying math is the same, but the scale is often easier for campaign teams to interpret.
How to Use a Target Unsubscribe Rate
A target rate should function as a monitoring threshold, not a universal pass-fail label. Use it to translate a percentage into an expected unsubscribe count at a given delivery volume, then compare actual results with your own history, campaign type and provider guidance.
For example, a 0.30% target implies 30 unsubscribes at 10,000 delivered emails but 300 at 100,000 delivered emails. Scaling the count with volume helps teams avoid reacting to raw unsubscribe totals without considering audience size.
What a 0% Unsubscribe Rate Does and Does Not Mean
A 0% unsubscribe rate means no recorded recipient in the measured delivered audience opted out during that reporting scope. It does not prove the campaign was highly engaging. A small list can show 0% simply because the sample is limited, while disengaged recipients may ignore the email rather than unsubscribe. Tracking or export timing can also delay recorded opt-outs.
Read a zero rate with open, click, conversion and complaint signals. If engagement is weak but unsubscribes remain at zero, the better conclusion may be that subscribers are inactive rather than delighted. The goal is not to force the number toward zero at any cost; the goal is a relevant permission-based audience that can easily express its preferences.
Single-Send Rate vs Trend Analysis
One campaign can move above or below a benchmark for reasons that do not persist. A subject, offer, holiday promotion, audience import or re-engagement send can change the unsubscribe mix for a single message. For operational decisions, compare a sequence of similar sends and watch whether the rate is stable, improving or repeatedly deteriorating.
When volume changes materially, compare percentages and unsubscribes per 1,000 rather than raw opt-out counts alone. A move from 10 unsubscribes to 20 may look alarming, but if delivered volume also doubled the underlying rate may be unchanged. Trend analysis is strongest when the denominator, campaign type and audience definition remain comparable.
What Is a Good Email Unsubscribe Rate?
There is no single good rate for every email program. Subscriber expectations, message purpose, acquisition source, frequency and campaign type can all change opt-out behavior. A newsletter, a promotional blast and a re-engagement campaign may not deserve the same benchmark.
Use external benchmarks as diagnostic context, then prioritize your own comparable baseline. A stable 0.18% campaign rate that suddenly rises to 0.45% after a frequency or audience change can be more actionable than whether the number sits above or below a generic industry average.
Current Unsubscribe Rate Benchmark Context
Klaviyo currently classifies an unsubscribe rate below 0.3% as healthy, 0.3% to 1% as room for improvement and above 1% as needing attention in its deliverability reporting. It also recommends aiming under 0.3% per email campaign. These are useful provider benchmarks, not universal laws.
The benchmark should be interpreted with the exact reporting definition and send type. Klaviyo itself notes that periodic preference-confirmation or list-cleaning messages may produce higher unsubscribe rates and should be read in context rather than treated like a normal promotional campaign.
Unsubscribe Rate by Industry and Audience
Industry labels alone do not explain unsubscribe behavior. Two businesses in the same category can have different list sources, message frequencies, price points and subscriber expectations. Instead of copying a broad industry target, segment your reporting by audience source, lifecycle stage, engagement level and send purpose.
How to Diagnose Unsubscribe Rate by Segment and Cohort
Start diagnosis by splitting the aggregate rate into groups that can explain behavior. Useful cuts include signup source, subscriber age, recent engagement, product interest, geography, lifecycle stage and campaign frequency. A list-wide average can hide one small segment with a sharp opt-out problem or one highly engaged segment that makes the total look healthier than the rest.
For example, if recent customers remain near their usual range while an older imported audience rises sharply, the next action should focus on the older cohort rather than reducing frequency for everyone. If a specific acquisition source produces consistently higher unsubscribes, review the promise, consent language and audience expectation at that source. Segment-level diagnosis turns the metric from a score into a troubleshooting tool.
Campaign vs Automated Flow Unsubscribes
Broadcast campaigns and automated flows can behave differently. A triggered welcome or post-purchase message is usually tied to recent user behavior, while a broad promotional campaign reaches a wider audience. Compare like with like: campaign against campaign, flow against similar flow, and re-engagement against re-engagement.
Newsletter Unsubscribe Rate
For newsletters, unsubscribe rate often reflects whether the promised content, cadence and audience fit remain aligned. If subscribers joined for weekly educational content but begin receiving frequent promotions, an opt-out increase may reflect expectation mismatch rather than one weak subject line.
B2B and Ecommerce Context
B2B and ecommerce programs can both use the same formula, but their audience behavior may differ. B2B lists often have longer buying cycles and role changes, while ecommerce programs may send more frequent promotional and lifecycle messages. Segment by business model and send type before comparing unsubscribe trends.
Why People Unsubscribe From Emails
People opt out for many reasons: too many messages, content that no longer feels relevant, a change in personal needs, unexpected promotions, weak personalization, poor acquisition quality or simply a desire to reduce inbox volume. One unsubscribe does not reveal the cause, so look for patterns across campaigns and segments.
Email Frequency and Fatigue
Frequency is one of the first variables to inspect when unsubscribe rate rises. Klaviyo notes that elevated unsubscribes can indicate recipients are receiving too many emails. Do not reduce frequency blindly, though. Compare engaged and unengaged segments, recent cadence changes and the value delivered by each send.
Content Relevance and Offer Fit
A technically well-designed email can still generate opt-outs if its content does not match why the subscriber joined. Strong relevance comes from aligning audience intent, lifecycle stage, product interest and message purpose. A lower-volume campaign sent to a more relevant segment can produce healthier engagement than a broad send.
Expectation Mismatch After Signup
Signup messaging sets the contract. If a form promises occasional product updates but the recipient receives daily promotions, the problem may begin before the first unsubscribe event. State the type and approximate frequency of messages clearly, then keep the ongoing program close to those expectations.
Audience Acquisition Quality
List source matters. Subscribers who knowingly requested your emails are more likely to understand what they will receive than addresses collected through unclear consent, old imports or unrelated promotions. When unsubscribe rate spikes, compare acquisition cohorts rather than treating the entire list as one audience.
Segmentation and Personalization
Segmentation can reduce avoidable opt-outs by limiting messages to people for whom the content is relevant. Useful dimensions include recent engagement, product category, lifecycle stage, purchase behavior, geography and stated preferences. Personalization should improve relevance, not merely add a first name.
Preference Centers and Frequency Choices
A preference center can give subscribers alternatives to a full opt-out, such as fewer emails or specific content categories. It should not be used to obstruct unsubscribing. The purpose is to let recipients choose a relationship that better matches their interests while still making a full unsubscribe clear and easy.
Re-engagement and Sunset Policies
Repeatedly mailing people who have stopped engaging can create fatigue and negative signals. A re-engagement sequence can test whether interest remains, while a sunset policy can reduce unnecessary sending to persistently inactive profiles. Evaluate these programs with engagement, complaint and unsubscribe metrics together.
Unsubscribe Rate vs Spam Complaint Rate
An unsubscribe is a recipient using the opt-out mechanism. A spam complaint is a recipient reporting the message as spam. They are different negative signals. Making unsubscribe easy can be preferable to frustrating a recipient who then chooses the spam button instead.
Klaviyo currently recommends keeping spam complaint rate below 0.01%, while its unsubscribe reference is below 0.3%. Do not add the rates together; track each separately because inbox providers and ESPs treat them differently.
Unsubscribe Rate vs Bounce Rate
Bounce rate measures failed delivery attempts. Unsubscribe rate measures opt-outs among delivered recipients. A bounced address did not receive the campaign, so it should not be treated as an unsubscribe opportunity. Use the Email Bounce Rate Calculator when diagnosing delivery failures.
Unsubscribe Rate vs Open Rate and CTR
Open rate and CTR are engagement signals; unsubscribe rate is a negative preference signal. A campaign can have strong clicks and still produce too many opt-outs if the message is valuable to one segment but irritating to another. Review both positive and negative responses before declaring a send successful.
Unsubscribe Rate vs Conversion Rate and ROI
Conversion rate and ROI measure downstream outcomes, not audience loss. High revenue can sometimes coexist with elevated unsubscribes, especially during aggressive promotions. The decision is not simply whether the campaign made money, but whether the short-term gain is worth the long-term list and deliverability effects.
How to Reduce Email Unsubscribe Rate
Start with causes you can test: reduce excessive frequency for disengaged profiles, improve segmentation, align content with signup expectations, set expectations in a welcome sequence, provide value beyond promotions, make preference choices available and retire persistently unengaged audiences when appropriate.
Change one major factor at a time when possible. If audience, cadence, offer and creative all change simultaneously, a lower unsubscribe rate may be impossible to attribute to one decision.
When a Higher Unsubscribe Rate Is Not Automatically Bad
Some campaigns intentionally clarify preferences or clean the audience. Klaviyo notes that messages encouraging subscribers to confirm whether they still want emails can produce higher unsubscribe rates. That may reduce list size while improving the quality of the remaining audience. Context matters more than chasing the lowest possible number.
Compliance and One-Click Unsubscribe Context
Unsubscribe mechanisms are also a compliance and mailbox-provider policy topic, but detailed legal requirements vary by jurisdiction and message type. For Gmail, Google currently requires one-click unsubscribe for relevant marketing and promotional traffic from bulk senders and recommends honoring unsubscribe requests within 48 hours. This guide does not target compliance queries or provide legal advice; the measurement takeaway is simply that the opt-out path should remain clear and functional rather than being hidden to improve a metric.
Common Unsubscribe Rate Reporting Mistakes
- Using attempted sends in one report and delivered emails in another.
- Mixing unique unsubscribers with raw unsubscribe event counts.
- Comparing newsletters, promotions and re-engagement sends as if they have identical expectations.
- Treating 0.30% as a universal law instead of provider benchmark context.
- Optimizing for low unsubscribes while ignoring spam complaints, clicks, conversions and list quality.
- Hiding the unsubscribe path to improve a vanity metric.
Practical Unsubscribe Monitoring Workflow
- Record delivered emails and unique unsubscribes from the same campaign scope.
- Calculate unsubscribe rate and unsubscribes per 1,000 delivered.
- Compare against the same send type, audience and provider definition.
- Review frequency, acquisition source, segmentation and recent content changes.
- Check spam complaints, bounces, CTR, conversion rate and ROI alongside the unsubscribe result.
- Test one meaningful change and document the outcome before changing multiple variables.
Frequently Asked Questions
Sources and Methodology
SolveIndex cross-checked unsubscribe-rate definitions and current threshold context against Klaviyo unsubscribe-rate guidance, Klaviyo deliverability performance targets, Klaviyo deliverability best practices, Klaviyo deliverability monitoring guidance, Mailchimp unsubscribe-warning guidance, and Google's email sender guidelines FAQ for current one-click unsubscribe context. Provider benchmarks are contextual references, not universal targets.
Reviewed September 16, 2026. The calculator does not connect to an email service provider, apply suppression logic or make compliance decisions; it calculates from the delivered-email and unique-unsubscribe values entered by the user.
Use the Email Unsubscribe Rate Calculator
Enter your own delivered-email and unique-unsubscribe counts to calculate the rate, unsubscribes per 1,000 and target headroom.
Open the Email Unsubscribe Rate Calculator