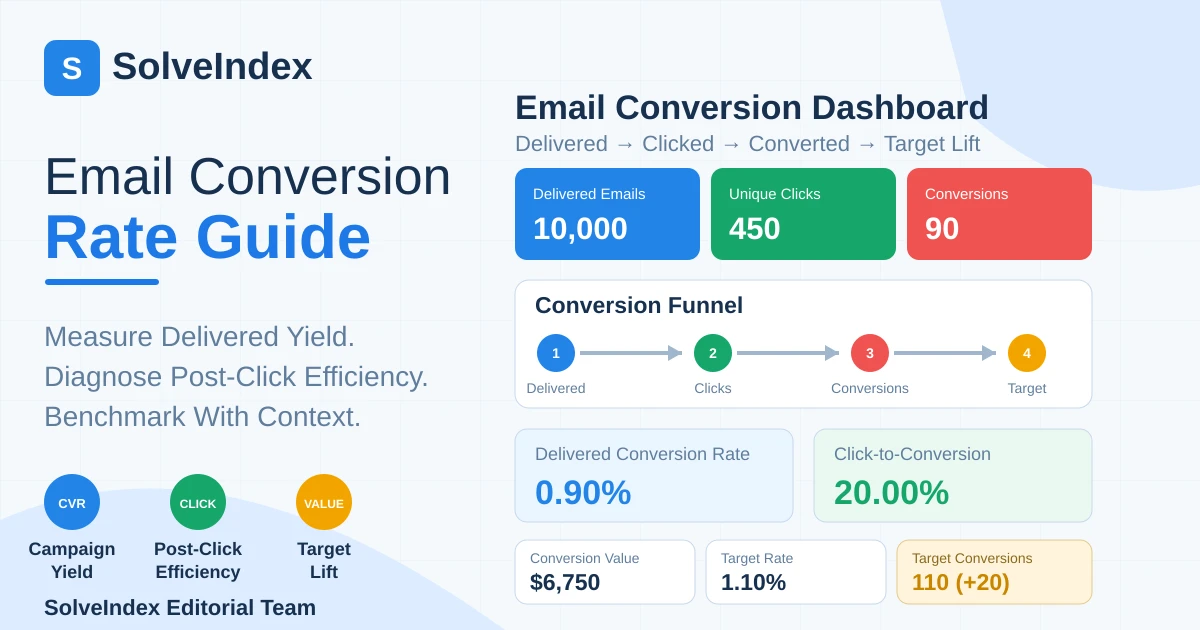
Email conversion rate connects email delivery and engagement with a business action such as a purchase, booking, registration or qualified request. The formula is straightforward, but the result is only comparable when the conversion event, denominator, attribution window and recipient scope are defined consistently.
What Is Email Conversion Rate?
Email conversion rate is the percentage of an email audience that completes a defined conversion action. In email reporting, the most common end-to-end version divides attributed conversions by successfully delivered emails. A second diagnostic view divides attributed conversions by unique email clickers to show how efficiently post-click traffic converts.
The phrase email marketing conversion rate is often used broadly, so every report should name both the numerator and denominator. “90 conversions from 10,000 delivered emails” and “90 conversions from 450 unique clicks” describe the same campaign but produce very different percentages because they answer different questions.
Email Conversion Rate Formula
Core email conversion formulas
Delivered-to-Conversion Rate = Tracked Conversions / Delivered Emails × 100Click-to-Conversion Rate = Tracked Conversions / Unique Clicks × 100Conversion Value = Tracked Conversions × Value per ConversionTarget Conversions = Delivered Emails × Target Delivered Conversion RateMailchimp currently defines email conversion rate in its reporting guidance as total conversions divided by total recipients, with total recipients representing successfully delivered emails. That matches the delivered-to-conversion rate used as the primary rate in the SolveIndex calculator. The click-based rate is shown separately as a post-click diagnostic.
Delivered-to-Conversion vs Click-to-Conversion Rate
Delivered-to-conversion rate measures end-to-end campaign yield: of the messages that reached recipients, what share ultimately produced the chosen action? Click-to-conversion rate starts later in the funnel: of the people who clicked, what share completed the action?
| Metric | Formula | Main question |
|---|---|---|
| Delivered-to-Conversion Rate | Conversions ÷ Delivered × 100 | How efficiently did the full delivered campaign create conversions? |
| Click-to-Conversion Rate | Conversions ÷ Unique Clicks × 100 | How efficiently did tracked email clickers convert after the click? |
| Email CTR | Unique Clicks ÷ Delivered × 100 | How often did delivered recipients click? |
| Email CTOR | Unique Clicks ÷ Unique Opens × 100 | How often did measured openers click? |
What Counts as an Email Conversion?
A conversion is the business action you choose to measure. Ecommerce teams may use completed orders; a software company might use trial starts or booked demos; a publisher may use paid subscriptions; and a service business might use qualified appointment requests. Do not mix actions with different business value inside one unlabeled conversion rate.
If a campaign generates several actions, report them separately or choose one primary conversion. A click, page view or email open is normally an engagement event, not automatically a conversion. The conversion definition should be stable enough that week-to-week or campaign-to-campaign changes represent performance rather than a changed rule.
Why Delivered Emails Matter in the Denominator
Delivered emails exclude messages that bounced and never reached the intended recipient. Using delivered messages therefore measures performance against the audience that had a realistic opportunity to respond. Mixing “sent” for one campaign and “delivered” for another can create an artificial conversion-rate difference even when conversion counts are unchanged.
Delivered-email conversion rate is especially useful for end-to-end campaign reporting because it combines upstream delivery and downstream response into one yield metric. Diagnose delivery problems separately with bounce and delivery rates instead of treating conversion rate as the only signal.
Why Unique Clicks Matter for Post-Click Conversion
Unique clicks are useful when the question is whether the landing page, checkout, form or offer converts the traffic email generated. Using unique clickers avoids letting repeated clicks from the same person inflate the denominator. Keep the same unique-versus-total counting policy across campaigns.
A strong click-to-conversion rate with a weak delivered-to-conversion rate often means the post-click experience works but too few delivered recipients click. A weak click-to-conversion rate with a healthy CTR points attention toward landing-page fit, offer clarity, form friction, checkout issues, pricing or audience expectations after the click.
Click-Attributed Conversion Model
The SolveIndex calculator intentionally uses a click-attributed model: tracked conversions are expected to come from the unique click pool, so conversions cannot exceed unique clicks. That constraint makes the arithmetic auditable for one-conversion-per-clicker campaign analysis.
Some analytics systems can credit view-through conversions, assisted conversions, multiple transactions from one clicker or other multi-touch outcomes. Those models can legitimately produce counts that do not fit this calculator’s sequential constraint. If your platform uses a different attribution model, reconcile the counting rules before using the values here.
Choose and Document the Attribution Window
Attribution answers how long after an email interaction a conversion can still receive email credit. A short click window can undercount delayed purchases; a long window can assign more revenue or conversions to email even when other channels influenced the customer. There is no single window that fits every buying cycle.
For performance comparison, consistency matters more than choosing a theoretically perfect window. Document whether conversions are click-through only, whether open/view-through credit is included, how cross-device identity is handled, and how cancellations or refunds are treated.
Worked Email Conversion Rate Example
Suppose a campaign delivers 10,000 emails, records 450 unique clickers and attributes 90 conversions to those clicks. Delivered-to-conversion rate is 90 ÷ 10,000 × 100 = 0.90%. Click-to-conversion rate is 90 ÷ 450 × 100 = 20.00%.
At $75 of value per conversion, the current attributed conversion value is $6,750. A 1.10% delivered-to-conversion target at the same 10,000 delivered emails implies 110 conversions, or 20 additional conversions. At the same $75 value, the target conversion value is $8,250.
| Metric | Current | Target scenario |
|---|---|---|
| Delivered emails | 10,000 | 10,000 |
| Conversions | 90 | 110 |
| Delivered conversion rate | 0.90% | 1.10% |
| Additional conversions | - | +20 |
| Value at $75/conversion | $6,750 | $8,250 |
Conversion Value and Revenue per Delivered Email
A rate by itself does not show business value. Adding a consistent average value per conversion converts the count into an attributed value estimate. For a purchase, average order value may be appropriate. For a qualified lead, a probability-weighted expected value may be more defensible than treating every lead as immediate revenue.
Value per delivered email can then be calculated as attributed conversion value divided by delivered messages. This helps compare campaigns with different list sizes, but it still depends on attribution and the value model. Use the matching Email Marketing ROI Calculator when the question is profit after campaign and delivery costs.
How to Set a Target Email Conversion Rate
Set targets from your own comparable history before borrowing an external benchmark. Segment by campaign purpose, audience, product category, lifecycle stage and traffic source. A retention flow aimed at existing customers should not be benchmarked against a cold acquisition blast simply because both are “email.”
Use the target as a planning scenario, not a guaranteed forecast. A higher rate applied to the same delivered volume estimates the conversions required to hit that target; it does not prove the extra conversions are achievable without changing traffic quality, offer or customer experience.
What Is a Good Email Conversion Rate?
There is no universal good email conversion rate. A good rate is one that is measured consistently, economically valuable and strong relative to an appropriate baseline. Conversion type matters: placing an order, requesting a demo and downloading a free asset have different levels of commitment and naturally different rates.
When comparing performance, ask whether the denominator is delivered emails or clicks, whether the metric represents campaigns or automated flows, whether the audience is new or returning, and whether the same attribution window is used. Without those controls, a “good” percentage can be misleading.
Average Email Conversion Rate: Use Context, Not One Number
Searchers often look for an average email conversion rate, but averages combine businesses with different products, audiences and conversion definitions. An ecommerce placed-order rate is not directly comparable with a B2B booked-demo rate, and a click-based rate is not directly comparable with a delivered-email rate.
A more useful benchmark stack is: your own historical median for the same campaign type, a comparable segment or lifecycle stage, then an external industry benchmark that documents its population and metric. Treat external averages as context rather than a target you must copy.
2026 Email Conversion Benchmark Context
Klaviyo’s 2026 ecommerce benchmark report, based on more than 183,000 customers, publishes placed-order rates rather than one universal “email conversion rate.” Across industries, the report shows an average campaign placed-order rate of 0.16% and a top-10% campaign rate of 0.36%. Automated flows are much higher in that dataset: 2.11% on average and 4.3% for the top 10%.
Those figures are useful for ecommerce context, not as universal SolveIndex targets. They measure a specific conversion-placed orders-inside Klaviyo’s customer population, and campaign/flow behavior differs substantially. If your conversion is a lead, booking, subscription or another event, use a benchmark built for that event or rely more heavily on your own baseline.
Email Conversion Rate by Industry
Industry can affect average email conversion because purchase frequency, order value, sales cycle, audience intent and offer type differ. Even within the same industry, campaigns and lifecycle automations can have very different conversion behavior. Compare similar message types before interpreting an industry average.
When documenting an industry benchmark, record the source year, sample population, conversion event, denominator and whether the figure represents campaigns, automated flows or both. This prevents a headline benchmark from being reused outside the context that created it.
Ecommerce Email Conversion Rate and Placed Orders
For ecommerce, a purchase or placed order is usually the clearest conversion event. Delivered-to-order rate shows the total campaign yield, while click-to-order rate isolates checkout and post-click efficiency. Revenue per recipient and email ROI provide additional context because two campaigns can have the same order rate but very different order values and margins.
Returns, cancellations, discounting and delayed orders can change the economic interpretation. If the reporting system attributes orders before refunds are known, reconcile later when material. Do not treat placed-order rate as a substitute for profit.
Cold Email Conversion Rates Are a Different Funnel
Cold email conversion-rate searches often refer to outbound sales outreach, where the funnel may be sent → delivered → reply → positive reply → booked meeting → opportunity → sale. That is not the same as a permission-based marketing email campaign measured from delivered recipients to a purchase or other conversion.
Because the funnel and legal/compliance context differ, cold-email benchmarks should not define the target for this general email marketing calculator. If you analyze cold outreach, label the event precisely-for example “booked meetings ÷ delivered cold emails”-and keep it separate from lifecycle or newsletter reporting.
Email Conversion Rate vs CTR
Email CTR measures unique clicks relative to delivered emails. It is an engagement metric: did recipients move from the email to the destination? Delivered conversion rate goes one step further and asks whether delivered recipients completed the business action. A high CTR with low conversion can indicate post-click friction or a mismatch between the email promise and landing page.
Email Conversion Rate vs CTOR
CTOR divides unique clicks by unique opens and is intended to describe click engagement among measured openers. Click-to-conversion rate divides conversions by unique clicks. One evaluates the email content after an open; the other evaluates what happens after the click. They should not be labeled interchangeably.
Email Conversion Rate vs Open Rate
Open rate is an upstream engagement signal and can be affected by privacy features, image loading and provider-specific tracking. Conversion rate is closer to the business outcome. Use open rate for diagnosing subject-line and early engagement patterns, but prioritize reliable clicks, conversions and value when assessing business impact.
Email Conversion Rate vs Email Marketing ROI
Conversion rate measures the frequency of the chosen action; ROI measures financial return relative to email campaign cost after the cost scope is defined. Improving conversion rate can improve ROI, but not always: lower-value conversions, heavier discounts or high product/service costs can reduce profit even when conversion frequency rises.
How Deliverability Affects Conversion Rate
Conversions cannot happen through email that never reaches the recipient. High bounce rates, spam placement and poor list hygiene can reduce the pool of delivered recipients and the number of people who can click or convert. Diagnose deliverability with dedicated bounce and delivery metrics rather than using conversion rate alone.
Segmentation, Personalization and Conversion
Segmentation can improve relevance by matching message, product, timing and offer to a more specific audience. Useful segments may reflect purchase history, lifecycle stage, engagement, geography or product interest. Measure conversion lift by segment while watching sample size and avoiding overly small groups that create unstable percentages.
Offer, Message and Conversion Intent
Conversion requires a clear value proposition and an action that matches recipient intent. The subject line may earn attention, but the body copy, CTA and offer need to set accurate expectations. Aggressive clickbait can raise clicks while lowering post-click conversion if the landing experience does not match the promise.
Landing Page and Post-Click Experience
When click-to-conversion rate is weak, inspect page speed, message continuity, checkout steps, form length, trust signals, payment options and device experience. Email cannot compensate indefinitely for a broken post-click path. Segment by landing page or destination when multiple offers are mixed in one campaign.
Mobile Friction, Forms and Checkout
A large share of email reading happens on mobile devices, so small tap targets, slow pages, difficult forms and desktop-first checkout flows can suppress conversion after otherwise successful email engagement. Review the full journey on common device sizes and preserve campaign parameters through redirects.
Campaigns vs Automated Email Flows
Scheduled campaigns and automated lifecycle flows often behave differently. Flows can be triggered by high-intent events such as browse abandonment, cart abandonment, post-purchase timing or replenishment, while broadcast campaigns may reach a broader audience. This is one reason benchmark sources commonly separate campaigns from automated flows.
A/B Testing, Sample Size and Volatility
Conversion rates can swing sharply when conversion counts are small. A move from one conversion to two conversions is a 100% increase but may not be stable evidence. Track the underlying counts, avoid declaring winners from tiny samples, and run tests long enough to capture the normal buying cycle when practical.
When testing subject lines, offers, creative or landing pages, choose one primary outcome in advance. If the primary goal is purchase conversion, do not select a winner solely because one variant generated more opens or clicks.
How to Improve Email Conversion Rate
- Protect delivery quality so eligible recipients actually receive the message.
- Segment audiences by lifecycle stage, intent and relevant behavior.
- Match subject line, email message, CTA and landing-page promise.
- Reduce post-click friction in forms, checkout and mobile experience.
- Use clear conversion definitions and reliable attribution tags.
- Test one meaningful variable at a time when possible.
- Analyze conversion value and ROI, not only conversion percentage.
- Separate campaigns, automations and cold-outreach funnels in reporting.
The best optimization opportunity depends on where the funnel is weak. If delivered-to-conversion rate is low because CTR is low, improve message relevance and CTA engagement. If CTR is healthy but click-to-conversion rate is weak, focus on offer and post-click experience. If conversion rate is healthy but ROI is poor, investigate value, discounting and cost structure.
Common Email Conversion Rate Mistakes
- Reporting a percentage without naming the denominator.
- Mixing sent emails with delivered emails between campaigns.
- Using total clicks for one campaign and unique clickers for another.
- Allowing different attribution windows without labeling the change.
- Mixing purchases, leads and registrations into one conversion count.
- Comparing cold outreach with opt-in lifecycle email benchmarks.
- Treating an ecommerce placed-order benchmark as a universal conversion target.
- Optimizing conversion rate without checking conversion value or ROI.
Practical Email Conversion Reporting Workflow
- Define the conversion event and business value.
- Choose delivered emails as the primary campaign-yield denominator.
- Record unique clickers for post-click analysis.
- Document attribution model and conversion window.
- Calculate delivered-to-conversion and click-to-conversion rates.
- Attach value where the valuation method is defensible.
- Segment by campaign type, audience and device when sample size allows.
- Compare with your own historical baseline and compatible external benchmarks.
- Review CTR, CTOR, bounce rate and ROI to locate the real bottleneck.
- Save the definitions with the report so future comparisons stay consistent.
Frequently Asked Questions
Sources and Methodology
SolveIndex cross-checked the delivered-recipient conversion-rate definition against Mailchimp email reporting metrics and broader conversion-rate methodology against Mailchimp conversion-rate guidance. For current ecommerce benchmark context, we reviewed Klaviyo 2026 email benchmarks and its 2026 benchmark analysis.
Reviewed September 14, 2026. Benchmark figures are presented only in the context of the source metric and population. The calculator does not connect to an email service provider or analytics account; it calculates from values entered by the user.
Use the Email Conversion Rate Calculator
Calculate delivered-to-conversion rate, click-to-conversion rate, conversion value and target lift from your own campaign data.
Open the Email Conversion Rate Calculator