Email bounce rate measures failed delivery attempts, but the useful diagnosis comes from the mix of hard and soft failures, the provider-reported reason, and what changed in your list or sending setup. Keep the metric separate from website bounce rate and broader inbox-placement deliverability.
What Email Bounce Rate Measures
Email bounce rate measures the share of email delivery attempts that fail or are rejected. It belongs at the start of the email funnel: a bounced message cannot become a delivered message, and a recipient who never receives the message cannot open, click, convert or unsubscribe from that send. Keep the metric email-specific-website and GA4 bounce rate are different web-analytics concepts.
Email Bounce Rate Formula
Bounce and delivery formulas
Total Bounces = Hard Bounces + Soft BouncesTotal Bounce Rate = Total Bounces / Emails Sent × 100Hard Bounce Rate = Hard Bounces / Emails Sent × 100Soft Bounce Rate = Soft Bounces / Emails Sent × 100For one campaign or reporting period, add hard and soft bounces, divide the total by emails sent, and multiply by 100. The calculator also shows the components separately so a single total percentage does not hide the type of failure.
Delivery Rate and Delivered Emails
Delivery formulas
Delivered Emails = Emails Sent − Total BouncesDelivery Rate = Delivered Emails / Emails Sent × 100In this model: Delivery Rate = 100% − Bounce RateIn this simplified sent-versus-bounced model, delivered emails equal sent emails minus total bounces, and delivery rate equals delivered emails divided by sent emails. That makes delivery rate equal to 100% minus bounce rate. Use the same provider report and scope for all inputs; suppressed or skipped recipients that were never actually attempted should not be mixed into the sent denominator.
Hard Bounce vs Soft Bounce
A hard bounce generally represents a permanent delivery failure, while a soft bounce generally represents a temporary condition. Klaviyo, for example, automatically suppresses addresses that hard bounce, while soft bounces are handled differently. Mailchimp also separates the two categories but notes that server responses are not perfectly standardized, so provider classification rules matter.
What Causes Hard Bounces?
Common hard-bounce situations include invalid or misspelled addresses, nonexistent domains, addresses that no longer exist, or recipient systems that permanently reject the message. A spike after an import, list purchase, form change or migration should trigger an immediate review of where the addresses came from.
What Causes Soft Bounces?
Soft bounces can come from temporarily unavailable mailboxes, full inboxes, message-size issues, temporary server problems, throttling, reputation signals or other conditions that may change. A single soft bounce does not always justify permanent removal, but repeated soft failures deserve investigation and should follow your provider's suppression policy.
SMTP Bounce Reasons and Provider Classification
Receiving servers often return SMTP replies that explain why a message failed. Mailchimp notes that some servers do not return perfectly formatted or standardized replies, so platforms may need to interpret the reason and classify it as hard or soft. That is why a dashboard's bounce label should not be treated as a universal SMTP taxonomy.
Worked Email Bounce Rate Example
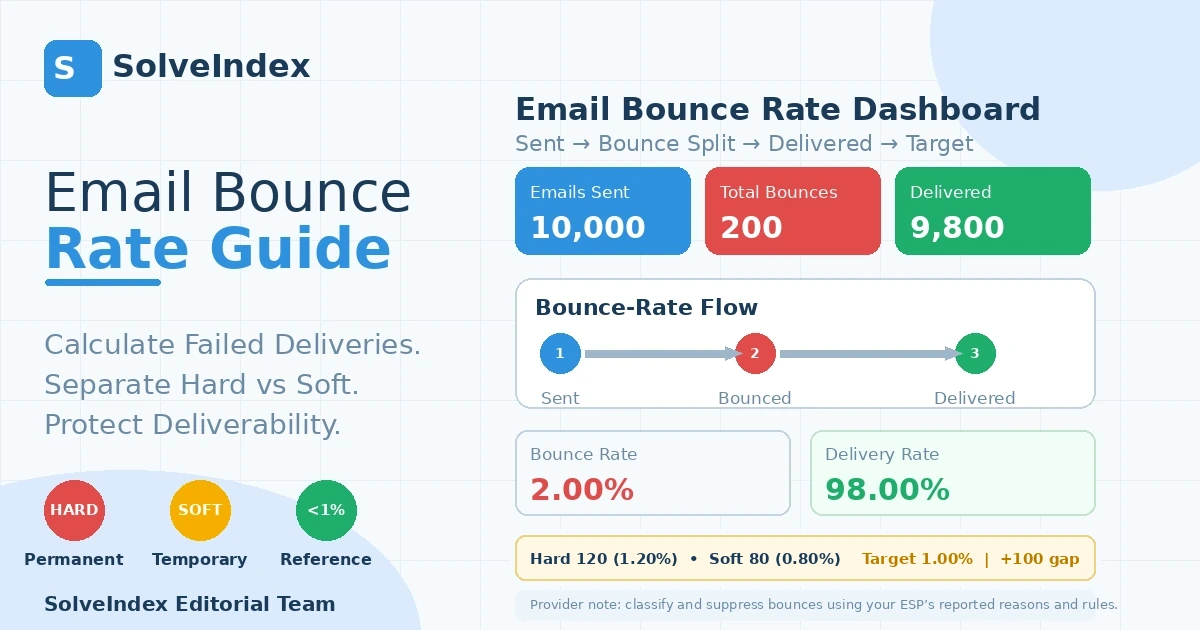
Suppose 10,000 emails are sent, 120 hard bounce and 80 soft bounce. Total bounces are 200, so total bounce rate is 2.00%. Hard bounce rate is 1.20%, soft bounce rate is 0.80%, estimated delivered volume is 9,800 and delivery rate is 98.00%.
At the same 10,000-email send volume, a 1.00% target corresponds to 100 bounces. The example is therefore 100 bounces above target. The target comparison is a planning signal, not proof of the root cause.
How to Use a Target Bounce Rate
With the default 1% planning target, 10,000 sent emails correspond to 100 bounces. The current example has 200, so it is 100 bounces above that monitoring target. A target is useful for operational alerting, but it should be a reference-not an excuse to ignore the hard/soft mix or provider-specific reasons.
What Is a Good Email Bounce Rate?
Lower is generally better because fewer failed deliveries mean more of the intended audience is reachable. As current provider context, Klaviyo labels bounce rates below 1.0% healthy, 1%-2% as room for improvement and above 2% as needing attention. Treat those bands as provider guidance rather than a universal industry law.
A healthy-looking total rate should still be segmented when possible. For example, a 0.8% total made mostly of hard bounces from one acquisition source may deserve more attention than a slightly higher rate dominated by temporary soft failures during a short-lived mailbox-provider issue. The percentage is a trigger for investigation, not the diagnosis itself.
Bounce-Rate Benchmarks: Use Provider Context Carefully
Bounce-rate limits and healthy ranges are not as universal as many benchmark tables imply. Mailchimp states that ISP and provider limits can vary and change, while Klaviyo publishes a <1% healthy reference. For decision-making, compare your current result with the same sender, provider, list source and campaign type before using a cross-industry average.
When you compare external benchmarks, verify whether the source uses all sent emails, only attempted sends, campaigns only, or campaigns plus automated flows. Also check whether the provider counts dropped or suppressed messages separately. Methodology differences can move the reported rate enough to make otherwise sensible comparisons misleading.
Bounce Rate by Industry
Industry can influence list age, acquisition method, sending cadence and mailbox mix, but a high bounce rate usually points more directly to address quality, acquisition process or technical delivery conditions than to industry alone. If you publish an industry comparison, keep the data source and methodology visible rather than treating one number as a universal standard.
B2B lists may contain job changes and abandoned corporate mailboxes; ecommerce lists may scale quickly through promotions and checkout capture; newsletters may accumulate inactive addresses over long periods. Those differences can change the causes of bounces, but they do not change the core formula. Diagnose the list and sender context instead of searching for one universal industry number.
B2B, Ecommerce and Newsletter Context
Broadcast campaigns and automated lifecycle flows can have different audience freshness and send triggers. A welcome flow may reach newly confirmed addresses, while a re-engagement campaign may intentionally contact older subscribers. Compare bounce rates within similar send types so list age and audience selection do not distort the conclusion.
Campaigns vs Automated Flows
If Gmail, Microsoft, Yahoo or another mailbox provider suddenly behaves differently from the rest of the list, that pattern can point to throttling, authentication, reputation or provider-specific policy issues. A domain-level view helps separate a list-quality problem from a delivery problem affecting one receiving ecosystem.
Check Bounce Patterns by Mailbox Provider
A single blended bounce rate can hide a weak signup source. Compare hard and soft bounce rates for website forms, imports, partners, events, paid lead sources and older database segments. If one source consistently produces more permanent failures, fix that acquisition process instead of cleaning the symptom after every send.
Segment Bounce Rate by Acquisition Source
Small sends can make bounce rate look volatile. One bounce in 100 sent emails is 1%, while the same single failure in 10,000 sends is only 0.01%. When volume is low, review the absolute bounce count and the specific reason alongside the percentage before declaring that deliverability has materially changed.
Bounce Rate and Sample Size
List Hygiene and Address Quality
Stale, malformed or low-quality addresses are common sources of bounce problems. Validate how addresses are collected, remove obvious formatting errors, avoid importing old lists without review, and monitor the effect of each acquisition source on hard-bounce rate. Healthy list growth is more valuable than raw list size if a large share of addresses cannot receive mail.
Consent, Double Opt-In and Acquisition Quality
Permission-based acquisition and double opt-in can reduce fake, mistyped or low-intent addresses before they enter the active list. Klaviyo specifically recommends emailing real, consented profiles and enabling double opt-in as part of lowering bounce rates. The exact workflow depends on your business, legal obligations and email platform.
Authentication, Reputation and Technical Factors
Bounces can also reflect technical or reputation problems rather than bad addresses. Sending volume, message size, authentication, domain configuration, sender reputation and receiving-server policies can all affect acceptance. If many previously healthy addresses fail at once, investigate system-wide factors before assuming the entire list became invalid.
Why Did My Bounce Rate Suddenly Increase?
Look for what changed immediately before the spike: a new list import, a new lead source, old dormant contacts, a domain or authentication change, a major volume increase, a new sending infrastructure, or a specific mailbox-provider issue. Segmenting bounce reasons by source and domain is often more useful than staring at the total percentage.
Does Bounce Rate Affect Sender Reputation?
High or rising bounce rates can harm deliverability and sender reputation because mailbox providers see repeated failed delivery attempts as a negative quality signal. Klaviyo explicitly warns that high bounce rates can hurt deliverability performance and sender reputation, so bounce monitoring should be part of routine sender-health work.
How to Handle Hard Bounces
Treat hard bounces as permanent failures unless your provider has evidence that a valid engaged address was misclassified. Respect your platform's suppression behavior, correct obvious data-entry errors only when you have a reliable source, and do not repeatedly resend to addresses that are known to be invalid.
How to Handle Repeated Soft Bounces
A temporary soft bounce may clear on a later attempt, but repeated soft failures can become an ongoing deliverability problem. Review the reported reason, mailbox domain, sending frequency and provider suppression rules. Do not assume every soft bounce should be retried indefinitely.
How to Reduce Email Bounce Rate
Start with address quality: improve signup validation, use permission-based collection, consider double opt-in, clean stale data, and separate risky acquisition sources. Then review sender authentication, reputation, volume changes and message characteristics. The goal is not to game the percentage; it is to reduce failed delivery attempts while protecting a healthy, consented audience.
After making changes, evaluate whether the improvement persists across several comparable sends. A one-off reduction can result from sending to a smaller or more engaged segment rather than from healthier acquisition. Sustainable improvement should show up in hard-bounce trends, source-level address quality and fewer recurring delivery failures.
Delivery Rate vs Deliverability
Delivery rate answers whether the receiving system accepted the message. Deliverability is broader: it concerns where accepted mail lands and whether mailbox providers trust the sender. A 99% delivery rate does not guarantee inbox placement, so do not use the bounce calculator as an inbox-placement test.
Bounce Rate vs Email Open Rate
Bounce rate uses emails sent as its denominator and measures failures before engagement. Open rate commonly uses delivered emails and measures recorded opens after delivery. A campaign can have a low bounce rate but weak open performance, or strong open performance among delivered recipients while bounce rate is still unhealthy.
Bounce Rate vs Unsubscribe Rate
A bounce means the message could not be delivered; an unsubscribe means a recipient who was reachable chose to opt out. Both are negative signals, but they diagnose different problems. Do not combine them into one rate or use one as a substitute for the other.
Bounce Rate vs Spam Complaint Rate
Bounce rate is a delivery-failure metric. Spam complaint rate measures recipients who mark delivered mail as spam. High values in either area can damage sender health, but the remedies differ: bounce problems often begin with address quality or technical delivery, while complaints point toward consent, relevance and expectation problems.
Common Bounce-Rate Reporting Mistakes
Common errors include dividing by delivered emails instead of sent attempts, mixing provider reports with different scopes, ignoring the hard/soft composition, treating pre-send suppressions as bounces, comparing email bounce rate with website bounce rate, and assuming a low total bounce rate means every list source is healthy.
Practical Bounce Monitoring Workflow
For each comparable send, record sent volume, hard bounces, soft bounces and provider-reported reasons. Calculate total, hard and soft rates; compare against your historical baseline and provider guidance; segment by acquisition source and mailbox domain when something changes; fix the underlying cause; then recheck downstream open, click and conversion metrics after delivery health stabilizes.
Keep a simple audit trail of list imports, signup-source changes, authentication updates and major sending-volume shifts. When a rate changes, that history gives you a short list of likely causes. It also makes post-fix validation easier because you can compare the same segment before and after the operational change rather than relying on an unrelated campaign.
Frequently Asked Questions
Sources and Methodology
SolveIndex cross-checked bounce definitions, healthy-range context and provider handling against Klaviyo bounced-email guidance, Klaviyo deliverability performance targets, Mailchimp About Bounces, Mailchimp bounce-reason documentation, and Mailchimp reporting definitions. Provider classification and suppression behavior can differ, so the guide keeps the arithmetic transparent and labels provider thresholds as context rather than universal rules.
Reviewed September 16, 2026. The calculator does not connect to an email service provider or inspect SMTP logs; it calculates from the sent, hard-bounce and soft-bounce values entered by the user.
Use the Email Bounce Rate Calculator
Enter your own campaign values to calculate the metric and review the visual and calculation breakdown.
Open the Email Bounce Rate Calculator