SaaS CAC is simple to divide and easy to define inconsistently. This guide explains the customer acquisition cost formula, fully loaded cost scope, paid-customer denominator, timing, benchmarks, CAC vs CPA, and how CAC connects with new MRR, LTV and payback.
What SaaS CAC Measures
SaaS customer acquisition cost (CAC) is the average amount spent to win one new paying customer. The metric becomes useful only when the numerator and denominator describe the same acquisition system: costs incurred to create new paid customers divided by customers that actually became paid under a documented reporting rule. That sounds simple, but most CAC disagreements come from scope rather than arithmetic.
For a subscription business, CAC is one part of unit economics. It tells you what acquisition costs, but not whether the acquired customer was worth the spend. Pair CAC with retention, gross margin, customer lifetime value and payback. A dollar CAC cannot be labeled good or bad without knowing the value and gross profit of the customers behind it.
SaaS CAC Formula
The standard formula is CAC = total sales and marketing acquisition costs in a period ÷ new paying customers acquired for the aligned period. SolveIndex separates marketing, sales and other acquisition costs so teams can see the ingredients before they are combined. The denominator is new paying customers, not total customers, leads, website visitors or free trials.
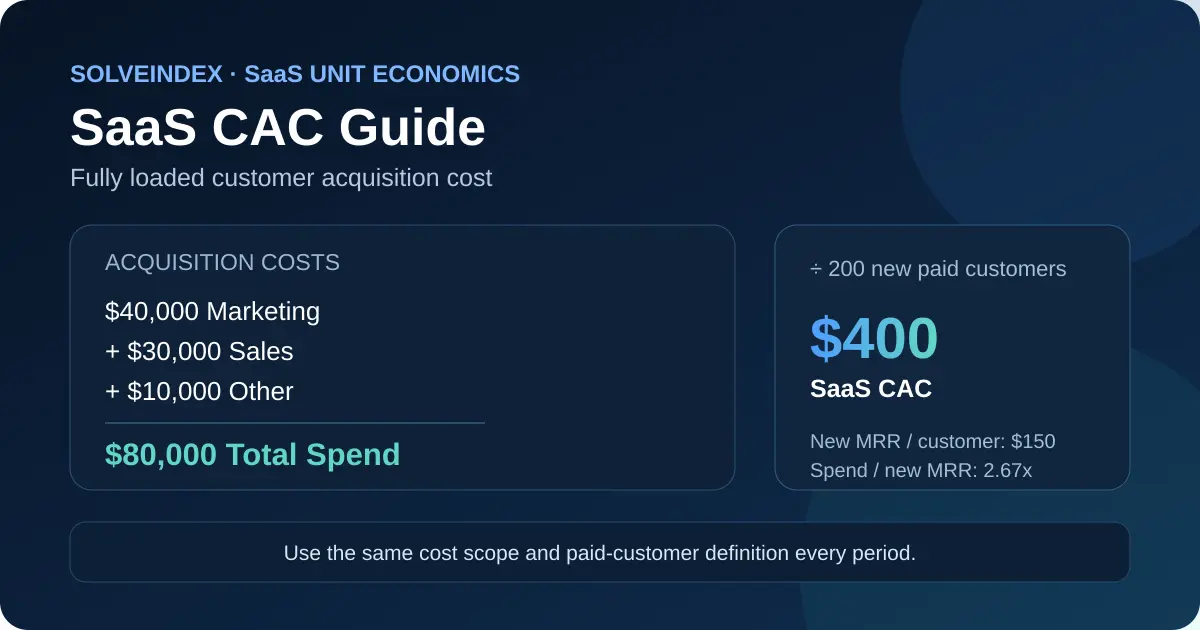
If marketing costs are $40,000, sales costs are $30,000 and other directly attributable acquisition costs are $10,000, total acquisition spend is $80,000. With 200 new paying customers, CAC is $400. Keep currency and reporting period consistent; mixing quarterly costs with monthly customer counts makes the result meaningless.
Fully Loaded CAC vs Narrow CAC
A fully loaded CAC includes the acquisition resources required to create demand and close customers, not only advertising invoices. Current ChartMogul methodology describes fully loaded CAC as including sales and marketing salaries, commissions, tooling, ad spend and events. A paid-media-only CAC can still answer a campaign question, but it is a different metric and will usually be lower.
The practical rule is to label the scope. If management reports fully loaded CAC this quarter and paid-media-only CAC next quarter, the trend is not comparable. For internal operating reviews, write the cost policy down and keep it stable unless you intentionally restate prior periods.
Marketing Costs to Include
Marketing CAC commonly includes paid search and social, sponsorships, content production, SEO programs, webinars, events, marketing agencies and demand-generation software when those costs are tied to acquisition. The goal is not to include every marketing-adjacent expense automatically; the goal is to include the acquisition spend covered by the organization’s chosen CAC policy.
Brand and content costs can be harder to attribute because they may influence customers over several months. If you include them in blended CAC, do so consistently. If you calculate channel CAC, allocate shared costs with a documented method instead of assigning them only to the channel that looks most expensive.
Sales Salaries, Commissions and Acquisition Payroll
For sales-led SaaS, acquisition economics can be distorted if CAC excludes the people required to close deals. Fully loaded CAC generally includes acquisition-related sales salaries, commissions and relevant sales-development costs. This is especially important for enterprise or mid-market motions where payroll is often a larger acquisition cost than paid advertising.
Be careful with shared roles. A sales leader, solutions engineer or revenue-operations employee may support both acquisition and existing customers. Allocate only the portion required by your reporting policy and apply the same method over time rather than changing allocations to improve the metric.
Tools, Agencies, Contractors and Events
CRM software, prospecting tools, marketing automation, attribution platforms, outsourced lead generation, agencies, contractors, conferences and events can all be legitimate acquisition costs when they support the acquisition process. The important question is whether the cost belongs to acquiring new paying customers under the selected CAC definition.
One-time implementation or annual software contracts should be recognized on a basis consistent with the reporting policy. Dumping a full annual tool bill into one month can make monthly CAC jump even when acquisition efficiency did not materially change.
Costs That Usually Do Not Belong in CAC
Product development, core infrastructure, customer support for existing users and general R&D are usually outside acquisition CAC because they do not represent the sales and marketing effort used to win new customers. Stripe’s SaaS CAC guidance likewise separates acquisition costs from support, infrastructure and R&D.
There can be gray areas, especially customer success activities that participate in expansion or pre-sale support. Instead of forcing every business into one universal policy, define the boundary and keep expansion, retention and acquisition metrics internally coherent.
What Counts as a New Paying Customer?
The denominator should normally count customers that became paying customers during the measurement logic used for CAC. A lead, demo, signup or free-trial start is not automatically a customer. Counting top-of-funnel actions in the denominator can make CAC look artificially low because the numerator includes acquisition spend while the denominator includes people who never paid.
The customer definition should also match the commercial model. For an account-based B2B product, one company account may be one customer even if it has many seats. For a consumer subscription, an individual subscriber may be the customer. Document the unit once and use it consistently.
Free Trials and Freemium Users
Free trials and freemium signups are valuable funnel metrics, but they usually should not enter paid-customer CAC until they convert to the paid-customer definition. Their acquisition costs can still be part of the numerator if those programs are part of the acquisition engine.
If your team needs cost per trial or cost per signup, report those separately as CPA-style funnel metrics. This prevents one metric from trying to answer two questions: how much it costs to create an intermediate action and how much it costs to win a paying customer.
Match Acquisition Costs and Customer Periods
Cost timing and customer timing must align. The simplest operating CAC uses costs from a month, quarter or year and new paying customers associated with that same reporting window. This is most defensible when the sales cycle is short and spend converts to customers quickly.
If the sales cycle is long, same-period matching can become noisy: spending in January may create customers in March. In that situation, supplement blended period CAC with cohort or lagged analysis. Do not selectively shift costs only in weak months, because that destroys trend comparability.
Long Sales Cycles and CAC Timing Lag
Enterprise SaaS often has multi-month sales cycles, procurement and implementation steps. A single-month CAC can therefore swing sharply even when the underlying sales motion has not changed. Quarterly or rolling-period analysis may better reflect the economics, while cohort analysis can link acquisition spend to the customers generated by that spend.
The right window depends on sales velocity, but the rule is consistent: state the window and do not compare numbers calculated from incompatible timing assumptions.
Blended CAC
Blended CAC combines the acquisition system into one average: all included acquisition costs divided by all new paying customers. It is useful for executive monitoring because it summarizes the overall cost to grow the customer base.
The weakness is that averages hide mix. A low-cost self-serve channel can offset an expensive enterprise motion, making the blended result look stable while segment economics change materially. Use blended CAC as the top-level view, then segment where decisions require more detail.
CAC by Acquisition Channel
Channel CAC applies the same formula to a channel-specific numerator and denominator. Examples include paid search CAC, outbound CAC, partner CAC or event CAC. It is useful for budget allocation when attribution and shared-cost allocation are sufficiently reliable.
Avoid comparing a channel CAC that contains only media spend with another channel CAC that includes people, tooling and agency costs. Scope consistency matters more than a visually precise decimal.
CAC by Customer Segment
SMB, mid-market and enterprise customers can have very different acquisition economics. Enterprise deals may require more sales labor and longer cycles but generate larger contracts and potentially higher gross-margin value. Segment CAC helps explain these differences without forcing every motion into one average.
Segment by dimensions that change the acquisition system-customer size, region, product line or sales motion-rather than slicing the data until sample sizes become too small to interpret.
Self-Serve vs Sales-Led SaaS CAC
Self-serve SaaS often concentrates acquisition costs in marketing, product-led conversion and automated onboarding. Sales-led SaaS shifts more cost toward SDRs, account executives, solutions support and sales tooling. A direct CAC comparison is incomplete unless the customer value, gross margin and sales cycle are also comparable.
This is why a higher enterprise CAC can still be economically rational while a lower consumer CAC can be unattractive if churn is high or gross margin is weak.
SMB vs Enterprise CAC
SMB acquisition tends to depend on higher volume and faster conversion, while enterprise acquisition may accept higher spend per customer in exchange for larger contracts. There is no universal CAC dollar benchmark that fairly compares both motions.
Use segment-specific CAC together with ARPA or contract value, retention, gross margin, LTV and payback. Those relationships tell you whether the acquisition model is sustainable.
Worked SaaS CAC Example
Take the calculator defaults: $40,000 of marketing acquisition cost, $30,000 of sales acquisition cost and $10,000 of other acquisition cost. Total acquisition spend is $80,000. If the business wins 200 new paying customers, SaaS CAC is $80,000 ÷ 200 = $400 per new paying customer.
If those customers add $30,000 of new MRR, new MRR per acquired customer is $150. Acquisition spend divided by new MRR is 2.67x. These supporting outputs describe the acquisition cohort; they are not substitutes for CAC payback or LTV:CAC, which incorporate different economic inputs.
| Metric | Example value |
|---|---|
| Marketing acquisition costs | $40,000 |
| Sales acquisition costs | $30,000 |
| Other acquisition costs | $10,000 |
| Total acquisition spend | $80,000 |
| New paying customers | 200 |
| SaaS CAC | $400 |
| New MRR | $30,000 |
| New MRR per acquired customer | $150 |
| Acquisition spend / new MRR | 2.67x |
Customers per $1,000 of Acquisition Spend
The inverse view can make efficiency easier to communicate. Customers per $1,000 of spend = 1,000 ÷ CAC. At a $400 CAC, the business acquires 2.5 customers per $1,000 of fully loaded acquisition spend.
This ratio moves opposite CAC: when CAC falls, customers per $1,000 rises. It is best used as an operational companion rather than a new benchmark because it contains the same underlying information as CAC.
New MRR per Acquired Customer
New MRR per acquired customer divides new business MRR by new paying customers. In the default example, $30,000 ÷ 200 = $150 per acquired customer. It provides immediate context about the starting recurring-revenue value of the new cohort.
This is closely related to Average Sale Price (ASP). ChartMogul defines ASP as new business MRR divided by the number of new customers who first converted to paid in the period. Keep the customer and MRR definitions aligned before treating the values as comparable.
Acquisition Spend / New MRR
Acquisition spend divided by new MRR is a simple scale comparison between acquisition investment and the monthly recurring revenue added by the cohort. With $80,000 of acquisition spend and $30,000 of new MRR, the ratio is 2.67x.
Do not interpret 2.67x as a payback period. Payback requires gross margin and time because a dollar of MRR is earned repeatedly over months and only part of revenue is gross profit. Use the dedicated CAC Payback metric for that question.
CAC vs CPA
CAC and CPA are often confused. CAC asks how much the company spends to win one paying customer. CPA asks how much a defined marketing action costs and that action could be a lead, signup, trial, booked meeting or purchase depending on the campaign.
A campaign can have a low CPA but a high CAC if few conversions become paying customers. Likewise, fully loaded CAC can exceed advertising CPA because CAC includes sales labor, commissions, tools and other acquisition costs beyond media spend.
CAC vs Average Sale Price (ASP)
CAC is acquisition cost; ASP is starting recurring-revenue value. ChartMogul defines ASP as new business MRR divided by new customers in the same period. Comparing them can help explain whether deal size is moving with acquisition cost, but one does not replace the other.
For example, rising CAC may be acceptable if new customers enter at materially higher MRR and retain well. A rising ASP without strong retention can still produce weak lifetime economics.
CAC vs LTV
CAC measures what it costs to acquire a customer. LTV estimates the value generated over the customer relationship. CAC therefore describes the upfront investment while LTV describes the expected economic return over time.
The two metrics must use compatible customer units and scopes. A fully loaded account-level CAC should not be compared with an LTV based on a different customer definition without adjustment.
CAC vs LTV:CAC
LTV:CAC divides lifetime value by acquisition cost. It is a separate ratio with its own search intent and should not be collapsed into this CAC page. Stripe and ChartMogul commonly discuss an approximate 3:1 rule of thumb, but the appropriate ratio varies with growth strategy, model assumptions, payback, risk and capital availability.
Use the dedicated SaaS LTV:CAC calculator when the decision is specifically about that ratio. This CAC page focuses on building the acquisition-cost denominator correctly.
CAC vs CAC Payback Period
CAC tells you the amount invested per acquired customer; payback tells you how many months of gross-margin contribution are needed to recover that amount. The payback formula therefore needs CAC, ARPA and gross margin, not just acquisition spend and customer count.
A business can have the same CAC across two segments but very different payback because deal size and gross margin differ. Use the dedicated CAC Payback page for time-to-recovery decisions.
What Is a Good CAC for SaaS?
There is no universal good SaaS CAC expressed as one dollar number. The measured search demand for “what is a good CAC for SaaS” reflects a real question, but a useful answer must be relative. CAC needs to be compared with gross-margin customer value, retention, payback, sales motion and available capital.
An enterprise SaaS business can rationally spend far more per acquired customer than a low-price self-serve product. A lower CAC is not automatically better if it comes from channels that produce lower-quality, high-churn customers.
SaaS CAC Benchmarks: Use Them Carefully
Benchmark reports can provide context, but CAC definitions vary materially. Some companies include fully loaded payroll and tooling; others report paid acquisition cost. Customer size, geography, product category, channel mix and sales cycle also shift the number.
Before comparing your CAC with a benchmark, check the population, year, customer segment, numerator scope and denominator definition. A benchmark with a different cost policy is not a like-for-like target.
Benchmark rule: compare only figures with compatible cost scope, customer definition, segment and time period. A lower benchmark is not automatically better if the customer value and sales motion differ.
B2B SaaS CAC and Benchmark Context
B2B SaaS often includes multiple acquisition motions inside the same company: product-led self-serve, outbound SDR/AE teams, partners and enterprise field sales. Their CACs can differ by multiples because the sales effort and contract value differ.
For B2B benchmarking, compare similar sales motions and customer sizes. The Semrush data for this page includes demand around B2B SaaS CAC and benchmark queries, but those terms should lead to methodology and comparison guidance rather than an unsupported universal benchmark.
How to Reduce SaaS CAC
Reducing CAC means improving the acquisition system, not simply removing costs from the numerator. Sustainable improvements can come from better targeting, higher conversion rates, faster sales cycles, stronger referrals, improved product-led activation, more effective channel mix or lower-cost sales operations.
If CAC falls only because the reporting policy stopped counting sales payroll or tools, economics did not improve. Keep the cost definition stable while optimizing the underlying process.
How Conversion Rates Affect CAC
When acquisition spend is stable, a higher proportion of leads, trials or opportunities converting into paying customers increases the denominator and lowers CAC. This is why landing-page conversion, sales qualification, trial activation and close rates can affect CAC even when media prices do not change.
Use funnel metrics to diagnose the cause, but keep CAC itself anchored to new paying customers so the unit-economics metric remains consistent.
Pricing and Deal Size Change the CAC Context
Pricing does not directly change the CAC formula, but it changes how much acquisition cost the model can support. Higher initial MRR or contract value can justify more acquisition effort when retention and gross margin remain healthy.
Track new MRR per acquired customer or ASP alongside CAC to see whether acquisition cost is rising because the company is intentionally moving upmarket or because the acquisition engine is becoming less efficient.
Retention Does Not Lower CAC, but It Changes the Economics
Retention occurs after acquisition, so stronger retention does not retroactively reduce historical CAC. It does, however, increase the value generated by the acquired customer and therefore changes how much CAC the business can economically tolerate.
This distinction is useful when teams say “our CAC is fine because retention is strong.” More precisely, the CAC is unchanged, while the LTV and payback context may make that CAC acceptable.
Common SaaS CAC Mistakes
Common errors include dividing by leads instead of paying customers, excluding sales payroll from a supposedly fully loaded CAC, mixing monthly spend with quarterly customers, counting existing-customer expansion as new customer acquisition, and comparing channel metrics with different cost scopes.
Another mistake is treating a single blended CAC as the complete acquisition picture. Segment when the business has materially different customer groups or sales motions, but avoid tiny segments where one deal can dominate the result.
Practical SaaS CAC Reporting Workflow
Start with the reporting question. Decide whether you need fully loaded blended CAC, a channel CAC or a segment CAC. Write down the cost categories, customer definition and time window before collecting data. Reconcile acquisition costs to finance records and new paying customers to billing or CRM records.
Calculate the current result, compare it with prior periods using the same policy, then investigate changes in spend, customer volume, channel mix, deal size and sales-cycle timing. Save the policy with the metric so future analysts can reproduce the number.
CAC Data Checklist Before Reporting
Confirm that marketing, sales and other acquisition cost categories are complete under the chosen policy; the customer count contains only the intended newly paid customer unit; periods are aligned; shared costs use a repeatable allocation; and segment definitions match across numerator and denominator.
If new MRR is entered, confirm it belongs to the same acquired cohort. Enter zero when you want CAC without new-MRR context rather than substituting unrelated recurring revenue.
Frequently Asked Questions
Sources and Methodology
The formulas and methodology in this guide were cross-checked against current SaaS metric documentation. CAC is a management metric, so internal cost allocation and customer definitions should be documented and applied consistently.
Use the SaaS CAC Calculator
Enter acquisition costs, new paying customers and optional new-MRR context to reproduce the worked example or test your own acquisition scenario.
Open the SaaS CAC Calculator