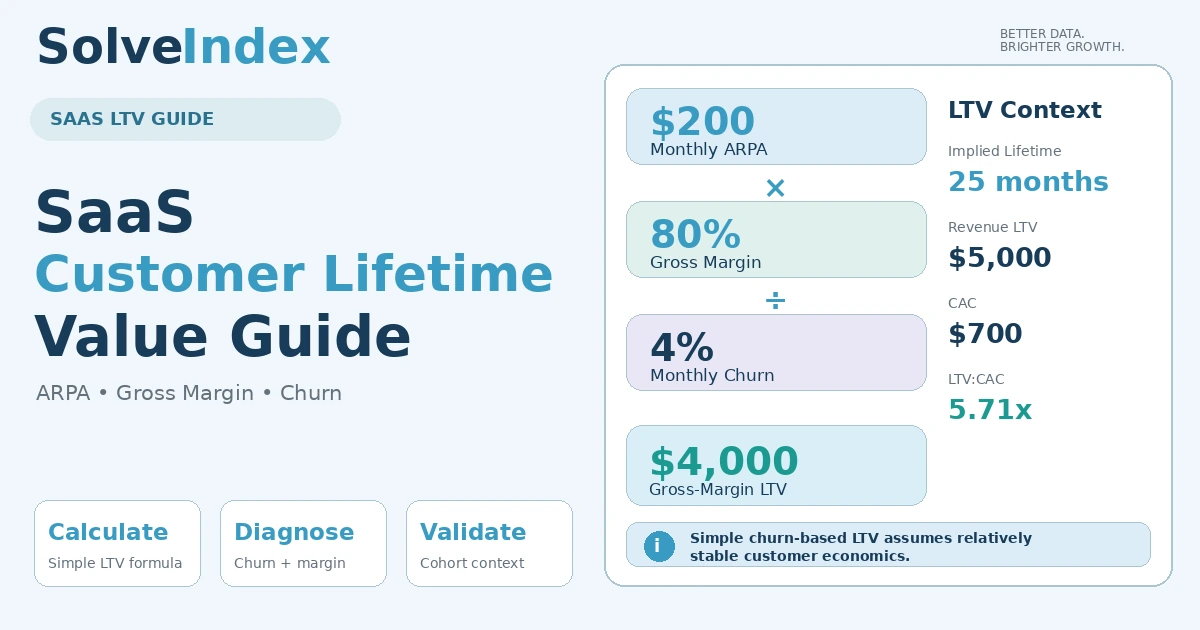
SaaS LTV, or customer lifetime value, estimates the economic value an average customer can generate before churning. This guide explains the simplified ARPA × gross margin ÷ customer churn model, where it works, where it breaks down, and how to keep LTV separate from CAC, payback and cohort-retention analysis.
What SaaS LTV Measures
SaaS LTV estimates the value of an average customer relationship over its expected life. The number is forward-looking: it combines a revenue assumption, a margin assumption and an expected retention pattern into one economic estimate. That makes LTV useful for planning, but it is not a booked accounting balance or a guaranteed amount of future profit.
For this SolveIndex model, the core inputs are monthly ARPA, SaaS gross margin and monthly customer churn. CAC is optional context in the economic sense; on the calculator you can enter zero when you do not want a CAC comparison. The output should be interpreted as a scenario based on those inputs, not as a universal value for every customer.
LTV, CLV and CLTV: Same Core Idea
In subscription analytics, LTV, CLV and CLTV are commonly used for the same core concept: customer lifetime value. ChartMogul explicitly treats LTV and CLV as different names for the same metric. The terminology varies by company, so a report should define whether the value is based on revenue, gross profit, contribution margin or discounted cash flow before teams compare results.
This guide uses SaaS LTV for the metric and distinguishes revenue LTV from gross-margin LTV. That distinction matters because a revenue dollar is not the same as a gross-profit dollar when the product has hosting, support, third-party or other delivery costs.
Simplified SaaS LTV Formula
ChartMogul describes the basic SaaS formula as ARPA multiplied by gross margin and divided by customer churn. It is a useful starting model because each input is operationally understandable: how much a typical account pays, how much gross profit remains after direct delivery costs, and how quickly customer accounts leave.
Percentages must be entered as decimals inside the arithmetic. An 80% gross margin is 0.80 and a 4% monthly churn rate is 0.04. The SolveIndex calculator handles that conversion automatically when you enter percentages in the form.
Customer Lifetime From Churn
At a constant 4% monthly customer churn rate, the reciprocal shortcut implies 25 months of expected lifetime: 1 ÷ 0.04 = 25. Under a constant per-period churn assumption, the reciprocal is a compact expected-lifetime estimate. It should not be confused with the observed average tenure of customers in a real cohort.
Real SaaS cohorts often have a different shape. New customers may churn heavily during onboarding, then stabilize after surviving the first few months. Others may renew annually rather than face an equal cancellation opportunity each month. Those patterns are why the simple lifetime estimate can diverge from cohort-observed behavior.
Monthly ARPA in the LTV Model
ARPA is average recurring revenue per account. In a monthly LTV model, use monthly ARPA from the same population represented by the churn rate. If the churn rate is calculated for SMB accounts but ARPA blends SMB and enterprise customers, the numerator and denominator describe different economics.
Segmenting ARPA is often more useful than using one company-wide average. A $50 self-serve plan, a $500 mid-market account and a $5,000 enterprise contract can have very different retention curves and cost-to-serve profiles. Combining them can create an average LTV that does not describe any actual segment well.
Gross Margin in the LTV Model
Gross margin converts revenue LTV into a gross-profit-oriented value. ChartMogul defines SaaS gross margin as revenue remaining after the direct cost of delivering the service, such as infrastructure, support and relevant third-party fees. This keeps LTV closer to the economic value available to cover acquisition and operating expenses.
A gross-margin LTV of $4,000 does not mean $4,000 of net profit. Sales, marketing, product development, general administration, taxes, financing and other expenses still exist. The adjustment simply prevents the model from treating every dollar of customer revenue as equally valuable.
Customer Churn vs Revenue Churn
The simplified reciprocal-lifetime model on this page uses customer churn, also called logo churn, not revenue churn. ChartMogul defines customer churn as the percentage of paying customers lost over a period, while revenue churn measures recurring revenue lost through cancellations and contractions.
The two can diverge sharply. Losing one large enterprise account can produce modest customer churn but severe revenue churn. Conversely, losing several tiny accounts may create high logo churn with limited revenue impact. Do not substitute net revenue churn or gross MRR churn into the 1/customer-churn lifetime formula without changing the model.
Keep ARPA and Churn on the Same Period
Monthly ARPA must be paired with monthly customer churn in this formula. If you use annual churn with monthly ARPA, the units no longer match and the implied lifetime is distorted. Convert or recalculate the inputs onto a common period before estimating LTV.
Be cautious with simple annualization. Multiplying a monthly churn percentage by 12 is not the same as compounding monthly retention over a year. For an operational LTV model, it is usually cleaner to keep both ARPA and churn in the native monthly period rather than converting back and forth.
Worked SaaS LTV Example
| Input / output | Example |
|---|---|
| Monthly ARPA | $200 |
| Gross margin | 80% |
| Monthly customer churn | 4% |
| Implied lifetime | 25 months |
| Revenue LTV | $5,000 |
| Gross-margin LTV | $4,000 |
| CAC | $700 |
| LTV:CAC | 5.71x |
The default example first calculates lifetime as 1 ÷ 4% = 25 months. Revenue LTV is then $200 × 25 = $5,000. Applying an 80% gross margin produces $4,000 of gross-margin LTV. With a $700 CAC, the contextual ratio is approximately 5.71x and modeled gross-margin LTV after CAC is $3,300.
Each result is only as credible as the assumptions. A small change in monthly churn has a large effect because churn sits in the denominator. That sensitivity is one reason LTV should be tracked with cohort retention rather than treated as a fixed company attribute.
Revenue LTV vs Gross-Margin LTV
Revenue LTV ignores direct service-delivery costs. Gross-margin LTV adjusts the revenue stream for gross margin and is therefore usually the more relevant version when comparing expected customer value with acquisition cost. The calculator shows both so you can see how delivery economics change the result.
If gross margin changes materially by product tier, geography or customer segment, use a matching margin for the cohort. Applying one company-wide margin to a services-heavy segment can overstate that segment’s LTV.
What CAC Adds to the LTV View
CAC measures the cost of acquiring a new customer; LTV estimates the value expected after acquisition. Looking at them together adds unit-economics context, but CAC does not change the underlying LTV formula. In the SolveIndex calculator, a positive CAC produces LTV:CAC and an after-CAC value, while entering zero lets you focus on LTV alone.
Use a CAC definition that matches the LTV population. If LTV is for enterprise accounts but CAC is blended across all channels and customer sizes, the comparison may be misleading even when each metric is mathematically correct.
SaaS LTV vs LTV:CAC
SaaS LTV answers “what is an average customer worth under these assumptions?” LTV:CAC answers “how large is that modeled value relative to acquisition cost?” The second is a ratio and has its own dedicated SolveIndex calculator and guide because target ratios, CAC scope and payback trade-offs require separate analysis.
Industry sources such as ChartMogul and Stripe often discuss roughly 3:1 as a rule-of-thumb LTV:CAC context, but that should not be converted into a universal dollar LTV target. A healthy dollar LTV depends on pricing, margin, churn, CAC, payback, company stage and capital strategy.
LTV vs CAC Payback
LTV looks across the modeled customer lifetime. CAC payback asks how many months of gross profit are needed to recover acquisition cost. Two companies can have the same LTV:CAC ratio but very different payback periods if their revenue timing, margins or contract structures differ.
Use both when acquisition spending matters. LTV describes the size of the modeled economic opportunity; payback describes how quickly cash invested in acquisition can be recovered.
What Happens When Churn Is Zero?
The reciprocal model becomes undefined at zero churn because division by zero implies no finite lifetime. That does not mean customer value is literally infinite. It means the model no longer has enough information to place an end point on the relationship.
For a zero-churn observation, use a bounded planning horizon, a longer historical window, a cohort survival model or another documented assumption. Stripe Billing, for example, uses a finite assumed lifetime when subscriber churn is zero in its own implementation rather than treating the value as infinite.
Why 1 / Churn Can Mislead
The basic formula effectively treats churn as stable over time. ChartMogul notes that real cohorts commonly have higher churn early in the customer lifecycle and lower churn among customers that survive longer. A constant-churn shortcut can therefore produce an overly optimistic LTV.
The formula also does not fully capture expansion, contraction, reactivation, price changes or discounted future cash flows. Its strength is transparency and speed, not precision under every subscription pattern.
Cohort-Based LTV
A cohort-based approach follows actual customers acquired in the same period or segment and observes retention, revenue and margin as the cohort ages. Instead of assuming a flat churn rate forever, it can reflect real survival curves and changes in account value over time.
Cohort LTV becomes especially useful when onboarding quality, customer maturity or contract renewal timing creates predictable changes in churn. It also helps distinguish whether an apparent company-wide improvement came from genuinely better retention or simply a shift toward higher-value customers.
Early-Life Churn and Retention Curves
Many SaaS products lose a disproportionate share of customers early, then retain the remaining cohort more effectively. A single monthly churn average smooths that shape into one number. If early-life churn is material, the reciprocal model can assume too many customers survive into later months.
Track retention by months-since-acquisition alongside calendar-month churn. That lets you see whether onboarding, activation or customer fit is driving the lifetime estimate rather than treating all customer ages as equivalent.
Expansion and Contraction
ARPA does not have to stay flat over a customer lifetime. Upgrades, additional seats and usage growth can increase account value; downgrades can reduce it. A simple LTV formula using today’s ARPA assumes those effects are either small or already reflected in a stable average.
For expansion-heavy businesses, a cohort cash-flow model can be materially different from ARPA ÷ churn. Keep NRR and expansion metrics available as context even when you use the simple calculator for a quick baseline.
Segment-Specific LTV
Company-wide LTV can conceal economically different segments. Calculate separate values for customer sizes, acquisition channels, geographies, products or contract types when their ARPA, gross margin or churn differs materially.
Segment-specific LTV is particularly useful for acquisition decisions because it can be paired with segment-specific CAC. Otherwise, a high-value enterprise cohort may subsidize an average that makes a weak self-serve channel look healthier than it is.
Plan and Pricing-Tier LTV
Pricing tiers often create different retention and service costs. A higher-priced plan can have a higher ARPA but also require more support or implementation work. Compare both ARPA and gross margin before concluding that a premium plan necessarily has higher economic LTV.
Use the same account definition in ARPA and churn. If one enterprise contract contains many end users, LTV at the account level should not be mixed with user-level churn or ARPU.
B2B vs B2C SaaS LTV
B2B and B2C subscription models can have very different account sizes, retention patterns, support costs and contract terms. A dollar LTV from one model is not a useful benchmark for the other without context.
Even within B2B SaaS, a low-ARPA self-serve product can behave more like a consumer subscription than an enterprise platform. Benchmarking should therefore start with a comparable customer population rather than a generic SaaS average.
Annual Contracts and Billing Frequency
Billing annually does not mean the LTV model should mix annual revenue with monthly churn. Convert contract economics to a consistent monthly ARPA or use an annual model with an annual customer-churn assumption. The units must match.
Annual contracts can also change when churn is observed because customers may only have a cancellation decision at renewal. In that case, a monthly steady-state churn approximation may be less intuitive than a renewal-cohort model.
Sensitivity to Monthly Churn
| Monthly churn | Implied lifetime | Gross-margin LTV* |
|---|---|---|
| 2% | 50.0 months | $8,000 |
| 4% | 25.0 months | $4,000 |
| 6% | 16.7 months | $2,667 |
| 8% | 12.5 months | $2,000 |
*Assumes $200 monthly ARPA and 80% gross margin.
Churn has a nonlinear-looking effect in practical decisions because it is the denominator. Cutting monthly churn from 4% to 2% doubles the simple modeled lifetime and doubles LTV, all else equal. That sensitivity also means small measurement errors in churn can materially change the output.
Sensitivity to ARPA
| Monthly ARPA | Gross-margin LTV* |
|---|---|
| $150 | $3,000 |
| $200 | $4,000 |
| $250 | $5,000 |
| $300 | $6,000 |
*Assumes 80% gross margin and 4% monthly customer churn.
ARPA scales the simple LTV model proportionally. But higher prices can also affect churn, expansion and acquisition cost, so a pricing change should not be modeled as an isolated ARPA increase if it materially changes customer behavior.
Sensitivity to Gross Margin
| Gross margin | Gross-margin LTV* |
|---|---|
| 60% | $3,000 |
| 70% | $3,500 |
| 80% | $4,000 |
| 90% | $4,500 |
*Assumes $200 monthly ARPA and 4% monthly customer churn.
Gross margin affects LTV linearly in the simple model. Improving delivery efficiency can increase gross-margin LTV even if pricing and churn are unchanged. Verify that margin improvements are real and not caused by moving direct delivery costs into operating expenses.
How Retention Changes LTV
Retention is often the highest-leverage LTV input because churn appears in the denominator. Better activation, product fit, support, reliability and renewal processes can all improve retention, but the effect should be measured in comparable cohorts rather than inferred from one volatile month.
Do not optimize the metric by redefining churn. A lower reported churn rate caused by changing the customer denominator or cancellation recognition policy is not the same as better customer economics.
How Pricing and Expansion Change LTV
Higher prices and successful expansion can increase ARPA, but their full LTV effect depends on whether retention changes. If a price increase causes churn to rise, the net LTV outcome can be smaller than the ARPA increase suggests.
Model pricing scenarios with both revenue and retention assumptions. For products with predictable upgrades, use cohort revenue curves or an advanced model rather than assuming one constant ARPA across the full customer lifetime.
Is There a Good SaaS LTV?
There is no universal good dollar LTV for SaaS. A $500 LTV may be attractive for a low-cost self-serve product and uneconomic for an enterprise sales motion. The value must be read against CAC, payback, gross margin, retention quality, customer segment and the capital required to acquire and serve the customer.
Ratio benchmarks can add context, but they should not replace unit-level economics. ChartMogul and Stripe discuss roughly 3x LTV relative to CAC as a common rule of thumb, while also noting that a very high ratio may reflect underinvestment in growth. The dedicated LTV:CAC guide should be used for that analysis.
Using LTV in Acquisition Budgeting
LTV can help estimate how much acquisition spend a segment may support, but acquisition budgets should not be set from LTV alone. Include CAC payback, cash runway, conversion rates, sales capacity and the uncertainty around the LTV estimate.
Use conservative scenarios when the business is young or churn data is sparse. A small number of observed cancellations can produce a volatile churn rate, which then gets magnified by the reciprocal formula.
When LTV Should Not Drive More Spend
A high modeled LTV does not automatically justify increasing acquisition spend. The number may be inflated by low observed churn from a short history, a few large accounts, unusually high gross margin assumptions or cohorts that have not reached renewal.
Before scaling spend, test whether LTV remains attractive under more conservative churn and margin assumptions. Pair it with payback and actual cash constraints so a long theoretical lifetime does not hide near-term financing risk.
Common SaaS LTV Mistakes
- Using revenue churn where the model expects customer churn.
- Mixing monthly ARPA with annual churn.
- Comparing revenue LTV directly with fully loaded CAC without considering gross margin.
- Treating 1/churn as an observed customer tenure rather than a model assumption.
- Using one company-wide LTV when segments have different ARPA, churn or cost-to-serve profiles.
- Assuming zero observed churn implies infinite customer value.
- Ignoring expansion, contraction or front-loaded churn when those effects are material.
- Using a universal “good LTV” target without acquisition and segment context.
SaaS LTV Data Checklist
- Monthly ARPA for the same customer population.
- Gross margin based on a documented SaaS COGS policy.
- Monthly customer/logo churn, not revenue churn.
- Enough history to reduce one-month volatility.
- Segment labels for material differences in account size or retention.
- CAC from a matching customer/channel population when using ratio context.
- Cohort data when customer behavior changes meaningfully with age.
Practical SaaS LTV Workflow
- Define the customer/account unit.
- Select a comparable customer segment and reporting window.
- Calculate monthly ARPA.
- Calculate monthly customer churn using the same population.
- Apply a documented gross-margin percentage.
- Calculate the simplified LTV baseline.
- Stress-test churn, ARPA and margin separately.
- Compare the estimate with cohort retention and realized customer economics.
- Add CAC and payback only when their definitions match the LTV population.
- Document the model version so trend changes are not caused by methodology changes.
When a More Advanced LTV Model Is Better
Use a more advanced model when expansion is material, churn changes strongly by customer age, contracts renew on discrete schedules, margin changes over time, or the decision requires discounted future cash flows. In those cases, a cohort cash-flow model can represent actual survival and account-value curves instead of forcing them into a steady-state shortcut.
The simple formula still has value. It is transparent, fast and useful for directional comparisons when the assumptions are reasonably stable. The key is to label it as a model and validate it against observed cohorts rather than treating the output as a fact.
Frequently Asked Questions
Sources and Methodology
SolveIndex cross-checked the simplified formula, churn definitions and model limitations against current primary or specialist sources. The calculator remains a transparent planning model rather than a claim that one LTV method is universally correct.
- ChartMogul - Customer Lifetime Value (LTV), updated September 8, 2026
- ChartMogul - Customer churn rate
- ChartMogul - Revenue churn
- ChartMogul - SaaS gross margin
- Stripe Billing - Calculating subscriber Lifetime Value
- Stripe - CAC in SaaS and LTV/CAC context
Reviewed September 26, 2026. Definitions and benchmarks can change by provider and population, so dated external heuristics are treated as context rather than universal targets.
Use the SaaS LTV Calculator
Enter monthly ARPA, gross margin, monthly customer churn and CAC context to reproduce the formula and stress-test assumptions.
Open the SaaS LTV Calculator