ARPU and ARPA are simple ratios with a surprisingly important denominator choice. This guide explains what ARPU means, how SaaS ARPA is calculated, why some platforms use the labels interchangeably, and how to compare user-level and account-level recurring revenue without mixing scopes.
What Is ARPU?
ARPU stands for average revenue per user. In this SolveIndex SaaS model, ARPU answers a user-level question: how much monthly recurring revenue is generated, on average, for each paying user or paid seat in the selected reporting scope. The default calculator uses normalized MRR in the numerator and paying users or seats in the denominator, so both sides of the formula describe the same recurring monthly population.
Industry usage is not perfectly standardized. Some analytics products use ARPU as another name for average revenue per account or customer. That is why the denominator matters more than the acronym. When comparing reports, document whether “user” means an individual seat, a subscriber, a customer account, or another billable unit.
What Is ARPA in SaaS?
ARPA means average revenue per account. For account-based SaaS reporting, it measures the average recurring revenue produced by one paying customer account during a period. SolveIndex calculates monthly ARPA as MRR divided by paying accounts, which is especially useful in B2B SaaS where a single customer account can contain several users or seats.
ARPA is a snapshot of the installed customer base, not the total amount a customer will pay over its lifetime. It can help with pricing, segmentation, customer mix, account economics, forecasting, and LTV inputs, but it should not be confused with lifetime value, annual contract value, or the initial selling price of a new deal.
ARPU and ARPA Terminology Is Not Universal
ChartMogul notes that ARPA, ARPU, and ARPC are often used interchangeably in SaaS. Other companies deliberately distinguish ARPA for accounts from ARPU for individual users. Stripe also uses ARPU in a subscriber-based sense in Billing. These conventions can all be internally consistent, but they are not automatically comparable.
SolveIndex therefore uses an explicit convention on this page: ARPU uses paying users or seats, while ARPA uses paying customer accounts. If your billing or analytics system labels the same customer denominator as ARPU, keep the system’s definition for internal reporting and translate the formula rather than renaming historical data.
The SolveIndex ARPU / ARPA Convention
The calculator is designed for businesses that want to see user-level and account-level monetization side by side. The same MRR amount is divided first by paying users and then by paying accounts. This isolates the effect of the denominator: a multi-seat account can raise ARPA relative to ARPU even when total recurring revenue does not change.
This convention is particularly useful for seat-based or workspace-based SaaS. It is less useful when every paying account has exactly one paying user, because the two denominators are then identical and ARPU equals ARPA. The calculator still works in that situation, but the distinction adds little analytical value.
ARPU vs ARPA: What Is the Difference?
ARPU focuses on the economic value of an individual user, seat, subscriber, or other user-level unit. ARPA focuses on the economic value of a customer account. The difference is not simply a naming preference when a single account can contain multiple paid users. In that case, each metric answers a different operating question.
ARPU can be useful for seat pricing, user monetization, consumption patterns, and product packaging. ARPA can be more useful for account segmentation, sales motion, customer success coverage, account-level retention, and customer lifetime value. Use the metric whose denominator matches the decision you are making.
ARPU Formula
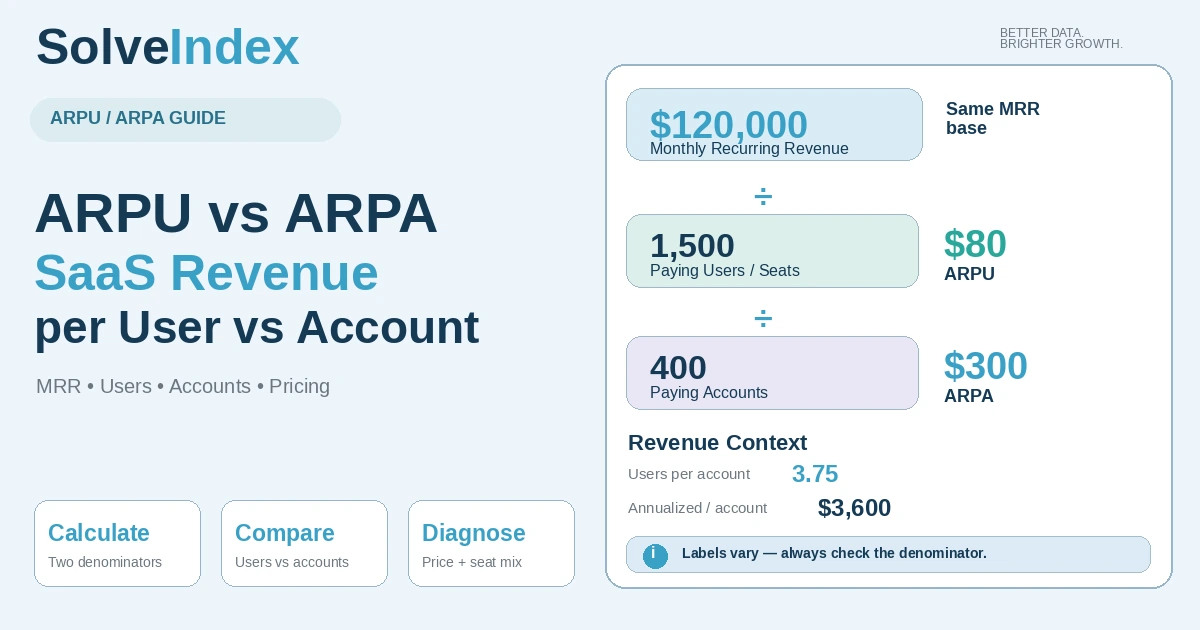
For this calculator, monthly ARPU is monthly recurring revenue divided by the number of paying users or paid seats in the same scope. With $120,000 of MRR and 1,500 paying users, ARPU is $80 per month. The numerator and denominator should cover the same period, customer segment, currency treatment, and product scope.
The formula is simple, but the user count can be ambiguous. Do not mix active free users, trial users, dormant users, and paid seats unless your reporting definition intentionally includes them. A lower denominator will mechanically raise ARPU, so a changing user definition can create a false pricing or monetization trend.
ARPA Formula
Monthly ARPA is monthly recurring revenue divided by the number of paying customer accounts in the same reporting scope. With $120,000 of MRR and 400 paying accounts, monthly ARPA is $300. If an account has several subscriptions, decide whether your reporting system consolidates them into one customer before calculating the denominator.
For a recurring-revenue SaaS view, MRR is usually cleaner than total accounting revenue because it excludes nonrecurring items that do not repeat with the account base. If you intentionally use a different revenue measure, keep that definition stable and label the result clearly rather than comparing it directly with an MRR-based ARPA series.
Why MRR Is the Revenue Base Here
MRR normalizes predictable subscription revenue to a monthly basis. That makes it a practical numerator when the denominators are paying users and paying accounts observed in the same monthly operating view. Stripe and ChartMogul both use MRR-based subscriber or account metrics in their subscription reporting contexts.
MRR is not the same as total recognized revenue. Setup fees, hardware, professional services, usage true-ups, and other one-time or nonrecurring items can make accounting revenue differ from MRR. Adding those items to the numerator while leaving the subscriber denominator unchanged can distort ARPU or ARPA comparisons.
Define Paying Users and Seats Before Calculating ARPU
A “paying user” can mean a licensed seat, an active billed seat, an individual subscriber, or another user-level unit depending on the product. In seat-based B2B SaaS, paid seats are often the cleanest denominator because they map directly to the pricing model. In a consumer subscription, an active paying subscriber may be the more natural unit.
Free users should usually be excluded from a paid-revenue ARPU unless the business deliberately tracks blended monetization across paid and unpaid users. If a product has large numbers of free users, a blended user metric can be useful for product monetization analysis, but it is a different KPI and should be labeled separately.
Define Paying Accounts or Customers Before Calculating ARPA
For ARPA, the denominator should represent distinct paying customer accounts in the same MRR scope. A B2B customer with ten subscriptions should not automatically become ten accounts if the company manages and retains that customer as one commercial relationship. The reporting system’s customer model needs to determine the unit.
Past-due accounts, paused subscriptions, reseller structures, parent-child workspaces, and consolidated enterprise contracts can all complicate the count. Write down the inclusion rule and keep it stable over time. A denominator policy change can move ARPA even if pricing and revenue do not change.
Worked ARPU and ARPA Example
Assume a SaaS business has $120,000 in normalized MRR, 1,500 paying users or seats, and 400 paying customer accounts. Dividing MRR by users gives $80 ARPU. Dividing the same MRR by accounts gives $300 ARPA. The account-level figure is higher because each account contains multiple paying users on average.
The relationship is reproducible: 1,500 users divided by 400 accounts equals 3.75 paying users per account. Multiplying $80 ARPU by 3.75 users per account also produces $300 ARPA. This identity is useful as a reasonableness check when both metrics use the same MRR scope.
| Metric | Example | Calculation |
|---|---|---|
| MRR | $120,000 | Normalized recurring monthly revenue |
| Paying users | 1,500 | User/seat denominator |
| Paying accounts | 400 | Account/customer denominator |
| Monthly ARPU | $80 | $120,000 ÷ 1,500 |
| Monthly ARPA | $300 | $120,000 ÷ 400 |
| Users per account | 3.75 | 1,500 ÷ 400 |
Paying Users per Account
Users per account equals paying users divided by paying accounts. It is not a revenue metric by itself, but it explains much of the mathematical gap between ARPU and ARPA in seat-based SaaS. With a common MRR base, ARPA equals ARPU multiplied by paying users per account.
Track this ratio alongside pricing changes. ARPA can rise because individual seats became more expensive, because customers bought more seats, or because the customer mix shifted toward larger accounts. Looking only at ARPA may hide which of those mechanisms actually drove the change.
Annual Recurring Revenue per Account
The calculator annualizes monthly ARPA by multiplying it by 12. In the default example, $300 monthly ARPA becomes a $3,600 annualized recurring revenue run rate per account. This is a convenient scale conversion when the underlying recurring revenue is stable.
Do not automatically call this ACV. Annual Contract Value can depend on contract length, committed recurring value, renewals, ramp schedules, discounts, and organization-specific definitions. ARPA × 12 is simply an annualized run-rate view of average current account revenue.
When Can ARPU and ARPA Be the Same?
ARPU and ARPA are equal under the SolveIndex convention when each paying account contains exactly one counted paying user. If MRR is $120,000, there are 400 paying users, and those 400 users map one-to-one to 400 accounts, both metrics equal $300.
They can also appear equal by coincidence if inconsistent denominators offset one another, which is why definition checks still matter. Do not use equality by itself as proof that the underlying user and account populations are aligned.
Why ARPU and ARPA Diverge
ARPA usually exceeds ARPU in multi-seat B2B SaaS because one account contains several paid users. The size of the gap is driven by users per account when both formulas use the same MRR. Larger workspaces, seat expansion, enterprise deals, and account consolidation can widen the gap.
ARPU can move independently when per-seat pricing, discounts, seat activation, or user-level packaging changes. ARPA can move because of account mix even when user monetization is stable. That is why reviewing both metrics can separate seat economics from account economics.
Seat-Based B2B SaaS
Seat-based B2B SaaS is where a deliberate ARPU-versus-ARPA distinction is most informative. ARPU can show whether revenue per paid seat is improving, while ARPA shows how valuable the average customer relationship is after considering how many seats each account carries.
For example, a move upmarket can increase ARPA even with unchanged per-seat pricing because larger companies buy more seats. Conversely, an aggressive seat discount could reduce ARPU while ARPA still rises if account seat counts expand faster. Those are different commercial stories and should be analyzed separately.
Consumer Subscription Context
In consumer subscriptions, one paying subscriber often corresponds to one account, so ARPU and ARPA may be effectively the same metric. Stripe Billing, for example, describes ARPU as MRR divided by active subscribers. In that reporting model, “user” is the subscriber/customer unit rather than a seat inside a business account.
Free Users and Trials
Free users and trial users generally should not be included in a paid-recurring-revenue denominator unless your purpose is explicitly to measure blended monetization. MRR comes from paying relationships, so pairing it with a denominator containing large numbers of nonpaying users can depress ARPU in a way that reflects funnel mix rather than customer pricing.
Usage-Based and Hybrid Pricing
Usage-based SaaS complicates average revenue metrics because revenue can change while account and seat counts stay flat. If usage charges are predictable and included in normalized MRR under your reporting policy, they can be part of the numerator. If usage is highly variable or recognized differently, a separate usage revenue metric may be clearer.
How Pricing Changes Affect ARPU and ARPA
A price increase applied broadly can raise both ARPU and ARPA, but the size and timing of the change depend on contract renewals, grandfathering, discounts, and customer mix. A per-seat price increase should normally show up directly in ARPU once affected users renew or reprice.
ARPA may move more slowly or more quickly depending on seats per account. If a higher price causes customers to reduce seats, ARPU can rise while users per account falls. Looking at MRR, ARPU, ARPA, and users per account together makes that trade-off visible.
Expansion and Contraction Effects
Expansion MRR from upgrades, add-ons, higher usage, or more seats can lift ARPA even without new customers. Contraction MRR from downgrades or seat reductions can lower it. For user-level analysis, the effect on ARPU depends on whether revenue and paid-seat counts move proportionally.
Customer Mix Can Move the Average
ARPU and ARPA are averages, so they can change when the customer mix changes even if no individual price changes. Winning more enterprise accounts can raise blended ARPA. Adding many low-cost self-serve customers can lower it while total MRR still grows.
Segment ARPU and ARPA Before Benchmarking
Segmentation is often more actionable than a single company-wide figure. Compare enterprise versus SMB accounts, self-serve versus sales-led customers, monthly versus annual contracts, and major pricing tiers. Stable definitions within each segment make trend changes easier to interpret.
ARPA vs ASP (Average Sale Price)
ARPA and ASP answer different questions. ARPA covers the current customer base and includes the effect of renewals, expansions, contractions, and the current mix of customers. ASP focuses on the initial recurring price of newly won customers at first conversion.
ChartMogul explicitly separates the two. Rising ASP can indicate larger new deals while ARPA remains flat if the installed base is much larger or existing customers contract. Use ASP for new-deal pricing trends and ARPA for the ongoing customer base.
ARPA vs ACV
ARPA is a periodic average revenue metric across current paying accounts. ACV is a contract-value metric that annualizes recurring contract value according to the contract term. They can be similar in simple annual subscriptions, but they are not generally interchangeable.
ARPU and ARPA vs MRR
MRR measures the scale of recurring monthly revenue. ARPU and ARPA normalize that MRR by a user or account denominator. A business can grow MRR while ARPA falls if customer count grows faster than revenue, or grow ARPA while MRR falls if low-value customers churn.
Use MRR to understand total recurring revenue movement and ARPU/ARPA to understand monetization per unit. Neither normalized metric replaces total revenue scale.
ARPA and Customer Lifetime Value
Account-level SaaS LTV commonly uses ARPA because both the revenue unit and customer churn unit are account-based. If monthly ARPA is $300 and the LTV model also uses customer-account churn, the numerator and retention denominator describe the same economic entity.
Using ARPU with account churn or ARPA with user churn can mix units. The result may still produce a number, but it is harder to interpret economically. Match the revenue denominator to the retention denominator before using an average-revenue metric in LTV.
Match the Revenue Unit to the Retention Unit
A practical rule is to model the same entity through revenue and retention. Account ARPA pairs naturally with account/logo churn. User ARPU can pair with user churn only when users are independent economic relationships rather than seats inside a shared account.
For multi-seat SaaS, account churn is usually the more commercially meaningful retention event because the company loses the whole account relationship. Seat reductions should often be treated as contraction rather than full customer churn.
How to Increase ARPU
Measured search demand in the Semrush export includes “how to increase ARPU.” The first step is to identify what the denominator represents. If ARPU is per paid seat, levers can include pricing, packaging, premium editions, add-ons, usage monetization, reduced discounting, or moving users to higher-value plans.
Avoid treating ARPU growth as an objective in isolation. A higher ARPU created by losing many lower-priced but profitable customers can coincide with weaker total MRR. Review customer growth, retention, expansion, gross margin, and conversion alongside the average.
How to Increase ARPA
ARPA can increase through higher prices, account expansion, more seats, upgrades, add-ons, usage growth, or a shift toward larger customer segments. Sales-led upmarket motion can raise ARPA even when product-level ARPU changes little.
Focus on durable value rather than forcing a higher average. Enterprise accounts may bring greater onboarding, support, and implementation costs. Pair ARPA growth with gross margin, retention, customer concentration, CAC payback, and account profitability.
What Is a Good ARPU or ARPA?
There is no universal good ARPU or ARPA. Stripe notes that a good ARPU depends on the company type and economics. A $10 consumer subscription and a $10,000 enterprise SaaS account can both be healthy businesses, so an absolute dollar benchmark is not meaningful without context.
A better comparison is your own trend within a stable segment and definition. Ask whether ARPU or ARPA is improving because customers receive more value, pricing is stronger, accounts are expanding, or customer mix changed. Then confirm that retention and profitability remain healthy.
How to Analyze ARPU and ARPA Trends
Track the metrics on a consistent cadence and annotate major pricing launches, packaging changes, migrations, acquisitions, and denominator-definition changes. Compare current values with prior periods and segment-level trends rather than relying on one snapshot.
When ARPU and ARPA move in different directions, decompose the change into MRR, paying users, paying accounts, and users per account. That four-part bridge often explains whether the driver was price, seats, account mix, or denominator methodology.
| Pattern | Possible interpretation |
|---|---|
| ARPU ↑, ARPA ↑ | Higher pricing or richer monetization across users and accounts |
| ARPU flat, ARPA ↑ | More paying users/seats per account or larger account mix |
| ARPU ↑, ARPA flat | Higher per-user revenue offset by fewer users per account |
| ARPU ↓, ARPA ↑ | Seat discounting alongside larger accounts can create this pattern |
Common ARPU and ARPA Reporting Mistakes
Common errors include using total revenue in one period and MRR in another, including free users in a paid ARPU denominator, counting subscriptions rather than accounts, changing the customer definition over time, and comparing account-level ARPA with a competitor’s user-level ARPU.
Another mistake is treating annualized ARPA as contract value or lifetime value. ARPA is a current-period average. ACV depends on contract economics, and LTV incorporates retention or expected customer lifetime. Keep each metric tied to its own decision.
Practical ARPU / ARPA Reporting Workflow
Start by defining the reporting period, currency, MRR policy, paying-user or paid-seat rule, and paying-account rule. Reconcile MRR to the subscription analytics source, then verify that the user and account populations belong to the same product and customer scope.
Calculate ARPU, ARPA, and users per account together. Segment the results, compare with prior periods, and investigate meaningful changes. Save the definitions with the metric so future analysts can reproduce the result even if the billing model, customer hierarchy, or product packaging changes.
Frequently Asked Questions
Sources and Methodology
Metric labels are not universal across SaaS analytics products, so this guide distinguishes source definitions from the SolveIndex user-versus-account convention. The formulas and reporting notes were cross-checked against the current sources below.
- ChartMogul - Average Revenue Per Account (ARPA), updated September 8, 2026
- ChartMogul Help Center - Average Revenue Per Account report methodology
- Stripe - Average Revenue Per User (ARPU), updated April 17, 2026
- Stripe Billing - ARPU as MRR divided by active subscribers
- ChartMogul - Average Sale Price (ASP), updated September 8, 2026
- Stripe - Monthly recurring revenue explained, updated May 11, 2026
Use the ARPU / ARPA Calculator
Enter one normalized MRR amount with paying users and paying accounts to calculate both denominators side by side, then compare users per account and annualized revenue per account.
Open the ARPU / ARPA Calculator