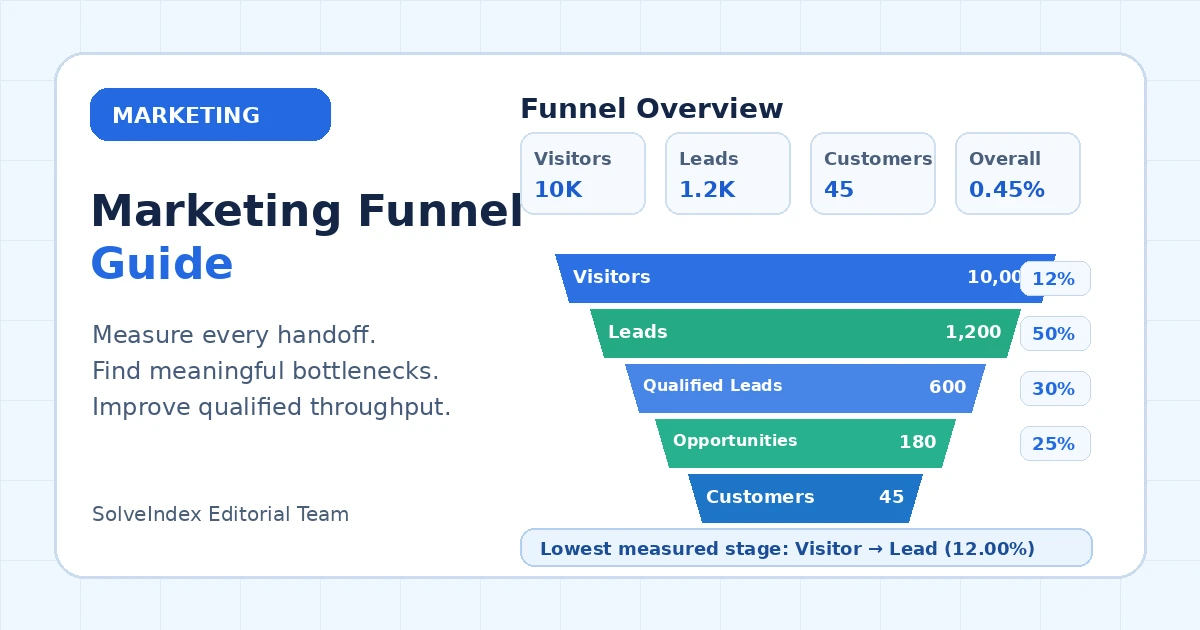
A marketing funnel turns a sequence of audience and sales stages into measurable conversion rates. The useful question is not simply whether the funnel is “good,” but where qualified demand is progressing, where it is leaking, and whether stage definitions are consistent enough to support a real decision.
The matching Marketing Funnel Calculator calculates each sequential stage rate plus the overall visitor-to-customer rate. It can also be used as a simple sales funnel calculator when your own stages map cleanly to the same nested sequence.
What a Marketing Funnel Measures
A marketing funnel represents movement from a broad early-stage audience toward increasingly qualified outcomes. HubSpot describes the marketing funnel as a framework for the customer journey from awareness toward purchase, while Salesforce describes a sales funnel as the path a prospect takes toward a purchase. In measurement work, the exact labels matter less than whether each stage has a clear rule and whether people are counted consistently.
This guide uses a practical five-stage model: visitors, leads, qualified leads, opportunities and customers. It is intentionally operational. A content team may prefer awareness, consideration and decision; a B2B revenue team may use MQL, SQL and opportunity; an ecommerce team may use product view, add to cart, checkout and purchase. The arithmetic is the same whenever the sequence is defined correctly.
Marketing Funnel vs Sales Funnel
Marketing funnels usually begin before a known sales opportunity exists. They can include anonymous traffic, subscribers, leads and marketing-qualified leads. Sales funnels typically begin later, once a prospect is known and being actively progressed toward a deal. In practice, B2B teams often connect the two into one revenue funnel.
| Model | Typical early stage | Typical later stage | Main question |
|---|---|---|---|
| Marketing funnel | Audience, visitor or lead | Qualified lead or customer | Where does demand become qualified? |
| Sales funnel | Qualified prospect | Opportunity or closed customer | Where do active prospects progress or stall? |
| Combined revenue funnel | Visitor or lead | Customer | How efficiently does the full system turn demand into revenue? |
The Five-Stage Funnel Used by This Calculator
The calculator uses five nested counts because this is detailed enough to expose major handoffs without requiring a company-specific CRM model. The sequence is Visitors → Leads → Qualified Leads → Opportunities → Customers. Each stage must be a subset of the previous stage for the same cohort or reporting scope.
Stage 1: Visitors or Sessions
The top of the calculator can represent visitors, users or sessions, but choose one definition and keep it stable. Users are people-like entities while sessions are visits, so switching the denominator changes the rate even if campaign performance does not change. For channel analysis, keep the same attribution rules and date range across every downstream stage.
Stage 2: Leads
A lead should represent a documented capture event: form submission, demo request, qualified signup, phone inquiry or another action that creates a prospect record. Avoid mixing low-intent newsletter subscriptions with high-intent demo requests unless the combined definition is deliberate. Visitor-to-lead conversion is only comparable when the lead rule is stable.
Stage 3: Qualified Leads, MQLs and SQLs
“Qualified lead” is intentionally generic. Some teams call this an MQL, others use a sales-accepted lead or SQL. Salesforce materials show that real organizations often use multiple qualification stages before a prospect becomes an active opportunity. You can map the calculator's qualified-lead stage to the qualification gate that matters most to your process.
Do not treat qualification as a failure merely because it removes many leads. A strong qualification step may intentionally lower volume while increasing downstream close rate, sales productivity and customer quality.
Stage 4: Opportunities
An opportunity should mean an active, sales-accepted commercial opportunity under a stable CRM rule. If one period counts every discovery call and another counts only proposal-stage deals, lead-to-opportunity performance becomes impossible to interpret. Document the opportunity threshold before using the rate as a management KPI.
Stage 5: Customers
The final stage should represent newly acquired customers tied to the measured funnel cohort where possible. For longer B2B cycles, customers may close weeks or months after the original website visit, so a same-month funnel can understate true conversion. Cohort-based reporting is usually more useful when sales cycles are long.
Marketing Funnel Conversion Rate Formula
Each stage conversion rate compares one stage with the stage immediately before it. The overall funnel rate compares customers with the first measured stage. These rates answer different questions, so do not replace a stage rate with the overall rate.
How to Calculate Each Stage Conversion Rate
Use the same method at every handoff: divide the downstream count by the immediately upstream count. If 1,200 of 10,000 visitors become leads, visitor-to-lead conversion is 12%. If 600 of those 1,200 leads become qualified, lead-to-qualified conversion is 50%. Never divide a downstream stage by an unrelated earlier stage and label the result as a stage-to-stage rate.
Overall Visitor-to-Customer Conversion Rate
Overall funnel conversion compresses the entire path into one number. In the default example, 45 customers from 10,000 visitors equals 0.45%. This is useful for high-level capacity planning, but it does not show which handoff changed. Use the stage rates to explain why the overall rate moved.
Conversion Rate vs Funnel Drop-Off
Conversion rate is a percentage; drop-off is the count that did not progress. Both matter. A small percentage decline at a very large stage can remove more people than a much lower percentage later in the funnel. The calculator computes stage drops internally, while its main output emphasizes rates so stages can be compared on a common scale.
Worked Marketing Funnel Example
Suppose 10,000 visitors produce 1,200 leads, 600 qualified leads, 180 opportunities and 45 customers. Visitor-to-lead conversion is 12%. Lead-to-qualified conversion is 50%. Qualified-to-opportunity conversion is 30%. Opportunity-to-customer conversion is 25%. Overall visitor-to-customer conversion is 0.45%.
| Stage | Count | Conversion from prior stage | Drop from prior stage |
|---|---|---|---|
| Visitors | 10,000 | Starting stage | - |
| Leads | 1,200 | 12.00% | 8,800 |
| Qualified leads | 600 | 50.00% | 600 |
| Opportunities | 180 | 30.00% | 420 |
| Customers | 45 | 25.00% | 135 |
How to Identify a Funnel Bottleneck
The calculator reports the lowest measured stage conversion rate as a diagnostic starting point. In the default example that is Visitor → Lead at 12%. A real bottleneck, however, is better defined as a stage that underperforms its own reasonable baseline, constrains qualified downstream volume, or shows a meaningful deterioration after accounting for mix and measurement changes.
Why the Lowest Rate Is Not Always the Problem
Funnels contain intentional filters. A 20% qualification rate may be healthy if it removes poor-fit leads and creates a much stronger opportunity win rate. Conversely, a 70% stage rate can still be problematic if it historically ran at 90% and the lost volume represents high-value prospects. Diagnose changes relative to stage purpose, quality and prior performance.
Marketing Funnel Benchmarks: Use the Right Baseline
Searches for a “good funnel conversion rate” are common, but a single universal benchmark is usually misleading. Rates depend on traffic source, brand demand, product complexity, sales cycle, price, geography, qualification rules and how each stage is defined. A visitor-to-lead rate for a high-intent demo page should not be compared directly with a broad informational blog audience.
Use three benchmark layers in order: your own historical stage rate for the same definition, a comparable internal segment such as channel or geography, and only then an external industry reference with documented methodology. If an external benchmark does not match your stage definition, treat it as context rather than a target.
Visitor-to-Lead Conversion Rate
Visitor-to-lead conversion measures demand capture. It is affected by traffic intent, landing-page relevance, offer strength, form friction, page speed, trust and lead definition. Semrush data supplied for this project shows direct search demand for “visitor to lead conversion rate,” so the guide treats it as a distinct stage rather than burying it inside a generic overall conversion discussion.
Lead-to-Qualified-Lead Conversion Rate
This rate measures how much captured demand meets your qualification rule. Changes can come from campaign targeting, form questions, scoring rules, sales acceptance criteria or product-market fit. If the rate falls while lead volume rises, check whether the new volume is lower quality before assuming qualification operations are failing.
Lead-to-Opportunity Conversion Rate
Lead-to-opportunity conversion is especially useful in B2B reporting because it connects marketing-generated demand with active sales pipeline. The exact denominator may be all leads, MQLs, SQLs or sales-accepted leads depending on your process. Name the denominator explicitly when reporting the rate.
The Semrush pack includes measured demand for “lead to opportunity conversion rate” and long-tail questions around average and benchmark values. The safest answer is definition-first: compare the same qualification stage, sales process and market before treating any external average as relevant.
Opportunity-to-Customer Conversion Rate
This is the closing stage in the calculator. It is influenced by deal quality, pricing, competition, product fit, sales execution and how an “opportunity” is defined. If opportunity creation becomes more permissive, the close rate can fall even when the sales team is performing the same. Track stage-definition changes alongside performance.
B2B Funnel Variations and Stage Naming
B2B funnels frequently introduce MQL, SAL, SQL, discovery, proposal or negotiation stages. Salesforce guidance emphasizes that pipeline stages should have clear meanings understood by the team. You do not need to force every business into the five labels used here; map your operational stages to the closest equivalent or calculate additional handoffs separately.
Open vs Closed Funnels
Google Analytics distinguishes open and closed funnels. In an open funnel, users can enter at later steps. In a closed funnel, they must enter through the first step and then complete the defined sequence. This calculator is a closed, nested-count model: each downstream count must be no greater than the stage before it.
If your real customer journey allows people to enter directly at opportunity or purchase, analyze that behavior separately rather than forcing the data into a closed sequence. The calculator is designed for a coherent cohort, not every possible nonlinear path.
Cohorts, Reporting Windows and Lag
A same-period funnel can be misleading when progression takes time. Visitors from September may not become opportunities until October or customers until November. For short cycles, period-based counts can still be useful. For long cycles, cohort reporting-following the same group forward-better preserves the relationship between numerator and denominator.
Segment Funnel Rates Before Diagnosing
Break the funnel down by channel, campaign, geography, device, product, account segment or lead source when sample size permits. Google Analytics Funnel Exploration supports breakdowns and segments because blended rates can hide very different journeys. A stable overall rate can contain one improving channel and another deteriorating one.
Funnel Conversion Rate vs Single-Step Conversion Rate
The Conversion Rate Calculator answers one numerator/denominator question, such as purchases divided by visitors. The Marketing Funnel Calculator answers several linked conversion questions at once. Use the single-step tool when you only need one conversion event; use the funnel tool when handoffs and bottlenecks matter.
Funnel Analysis vs Lead-to-Customer Conversion
The Lead-to-Customer Conversion Rate Calculator isolates one important closing ratio: customers divided by leads. Funnel analysis keeps the intermediate qualification and opportunity stages visible. This prevents a weak middle-stage handoff from being hidden inside one combined close rate.
Connect Funnel Rates With CPL and CAC
Conversion efficiency does not tell you acquisition economics by itself. Use the CPL Calculator to connect spend with lead volume and the CAC Calculator to connect acquisition costs with new customers. A funnel can improve its conversion percentages while becoming more expensive if traffic or sales costs rise sharply.
How to Improve Marketing Funnel Conversion Rates
Work on one constrained handoff at a time. For visitor-to-lead, improve message-to-intent alignment, landing-page clarity and offer friction. For lead qualification, improve targeting, capture fields and scoring logic. For lead-to-opportunity, investigate speed-to-lead, qualification handoff and sales acceptance. For opportunity-to-customer, examine deal quality, objections, pricing, competitive losses and sales process.
Measure downstream quality after every improvement. Raising an early-stage percentage by admitting lower-quality prospects can make the top of the funnel look better while reducing opportunity quality and increasing CAC.
Reverse Funnel Math and Capacity Planning
Historical stage rates can be reversed to estimate upstream volume required for a customer target. At a 25% opportunity-to-customer rate, 50 customers require about 200 opportunities. At a 30% qualified-to-opportunity rate, 200 opportunities require about 667 qualified leads. Continue reversing the funnel only if the rates are realistic for the planned scale.
Common Funnel Measurement Mistakes
- Mixing users, sessions and contacts without documenting the denominator.
- Comparing stages from different date ranges or attribution windows.
- Changing MQL, SQL or opportunity definitions without annotating the change.
- Using blended rates when channel or product mix changed materially.
- Calling the mathematically lowest rate the root cause without investigation.
- Using a universal benchmark as a target despite different stage definitions.
- Projecting higher volume with unchanged rates after sales or operational capacity becomes constrained.
- Optimizing one stage while downstream conversion quality or customer economics deteriorate.
Practical Funnel Analysis Workflow
- Write the exact stage definitions before pulling data.
- Choose one cohort or reporting window and keep it consistent.
- Validate that every downstream count is a subset of the previous stage for this model.
- Calculate every stage rate plus the overall visitor-to-customer rate.
- Compare each stage with its own historical baseline.
- Segment by channel, campaign, geography, product or lead source where useful.
- Investigate the stage with the largest meaningful deterioration, not merely the lowest percentage.
- Connect conversion changes to CPL, CAC and customer value.
- Recalculate after process, scoring, campaign or capacity changes.
Frequently Asked Questions
Sources and Methodology
SolveIndex cross-checked funnel measurement concepts against Google Analytics Funnel Exploration documentation, including sequential steps, segmentation and open versus closed funnels; HubSpot's marketing funnel definition; and Salesforce's sales funnel guidance. The calculator itself uses transparent arithmetic and does not estimate industry benchmarks.
Reviewed September 8, 2026. Benchmark discussion in this guide is methodological rather than a universal numeric target because funnel stages, traffic quality and qualification definitions vary materially between businesses.
Use the Marketing Funnel Calculator
Enter one consistent sequential funnel and calculate every stage conversion rate plus the overall visitor-to-customer rate.
Open the Marketing Funnel Calculator