Conversion rate is simple arithmetic wrapped around an important measurement decision: what counts as the eligible audience, and what counts as a conversion? This guide explains the formula, website and marketing use cases, target scenarios, benchmark context, CRO basics and the differences between visitor/session models, GA4 key-event rates and Google Ads conversion rate.
What Conversion Rate Measures
Conversion rate measures the share of an eligible population that completes a defined outcome. For a website, that population might be visitors or sessions and the outcome might be a purchase, signup, booked demo, account creation or another primary business action. The percentage becomes useful only when the numerator and denominator describe the same scope and reporting period.
A conversion percentage should answer one clear question. “What share of product-page sessions purchased?” is different from “What share of leads became customers?” and different again from “What share of Google Ads interactions produced a tracked conversion?” The formulas may look similar, but the denominator, counting rule and decision context change the meaning.
Conversion Rate Formula
Core formulas
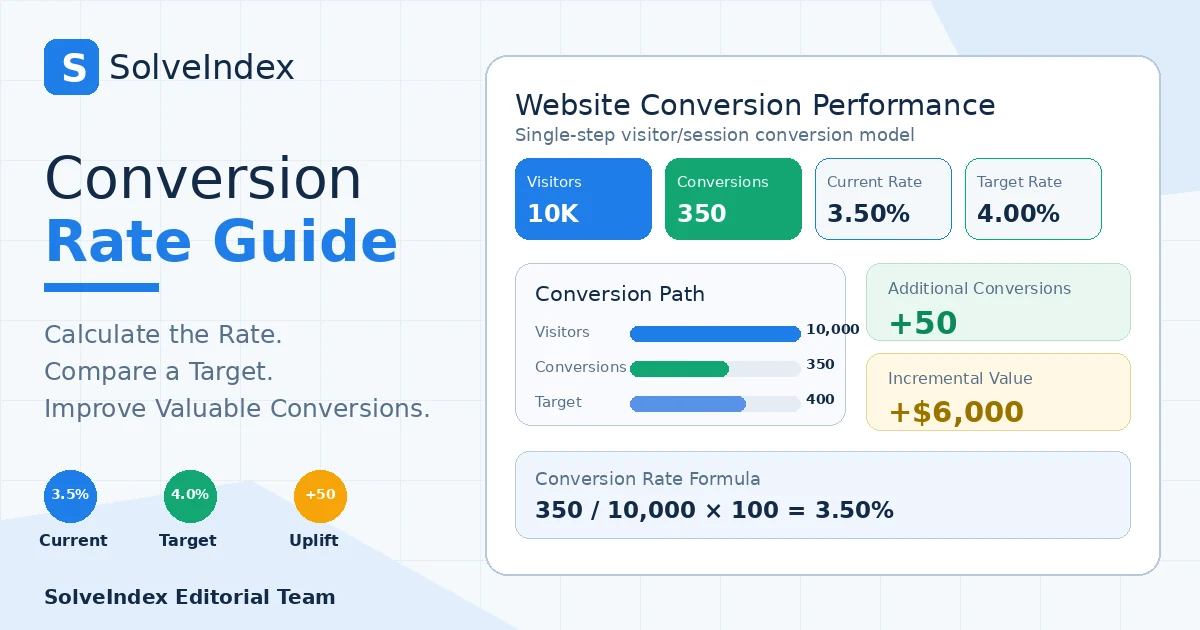
Conversion Rate = Conversions / Visitors or Sessions × 100Conversions at Target = Visitors or Sessions × Target Conversion RateAdditional Conversions = Target Conversions - Current ConversionsIncremental Value = Additional Conversions × Value per ConversionIf 350 conversions come from 10,000 eligible visits, the conversion rate is 3.5%. The arithmetic is straightforward; most reporting errors happen because teams compare rates built from different traffic definitions, conversion actions, attribution settings or time windows.
What This Calculator Measures
The SolveIndex Conversion Rate Calculator uses a deliberately simple one-counted-conversion-per-visitor-or-session model. Conversions cannot exceed the entered visitor/session count and a target rate is limited to 0% through 100%. That makes the tool suitable for questions such as signup rate, purchase-session rate or the percentage of visitors that completed one selected outcome.
Do not force a platform metric into this model if the platform counts multiple conversion events per interaction or uses a different denominator. In those cases, use the platform's own definition and treat this calculator as a planning model for a single counted outcome.
Visitors vs Sessions vs Users
“Website conversion rate” is not fully defined until the denominator is named. A user can generate multiple sessions, and a session can include multiple page views. A user-based conversion rate asks what share of people converted; a session-based rate asks what share of visits converted. Neither is automatically better. Choose the denominator that matches the decision and keep it stable across comparisons.
For landing-page or campaign analysis, sessions may be practical because they align with visits. For account creation, subscription or customer-level analysis, users may be more meaningful. Label reports explicitly so a 4% user conversion rate is not compared with a 4% session conversion rate as though they were identical.
What Counts as a Conversion
A conversion should represent a clearly defined action tied to the decision. Purchases, qualified demo requests, trial starts and completed signups are common examples. Micro-actions such as a scroll, button click or video view can be useful diagnostics, but combining them with purchases in one headline conversion rate can make the metric difficult to interpret.
Keep the event definition stable over time. If a “lead” changes from any form submission to only sales-qualified requests, the measured rate can fall even when business quality improves. Record tracking changes so performance shifts are not confused with measurement changes.
Worked Conversion Rate Example
Suppose a site receives 10,000 eligible visits and records 350 conversions. Current conversion rate is 350 / 10,000 × 100 = 3.5%. If the planning target is 4%, the same traffic level would imply 400 conversions, which is 50 more than the current count.
If each conversion has an average planning value of $120, the current conversion value is $42,000 and the 50-conversion gap represents $6,000 of incremental value. That is a scenario, not a forecast: it assumes traffic volume, traffic mix and value per conversion remain constant while only the rate changes.
How to Calculate Conversion Rate
- Choose one conversion action.
- Choose an eligible denominator such as users or sessions.
- Use the same date range and traffic scope for both numbers.
- Divide conversions by the denominator.
- Multiply by 100 to express the result as a percentage.
- Document the definition before comparing the rate with another period, segment or benchmark.
Semrush data for this page also surfaced long-tail queries such as “website monthly visits conversion rate calculation.” The answer is the same principle: use the conversions attributed to those visits, divide by the comparable visit total and label the denominator clearly.
How to Use a Target Conversion Rate
A target rate converts an improvement goal into an absolute conversion gap. At 10,000 visits, moving from 3.5% to 4% implies 50 additional conversions. This is useful for prioritizing experiments because it makes the size of the required improvement visible.
Targets should come from your own historical performance, business economics and plausible optimization opportunities. Copying a benchmark without matching the same channel, device, offer and conversion definition can create an arbitrary target. A target can quantify ambition; it cannot prove that the uplift is achievable.
Can Conversion Rate Be Over 100%?
Yes in some reporting systems, but not in every measurement model. Google Ads states that its conversion rate can exceed 100% when more than one conversion is counted for an eligible ad interaction, for example when multiple conversion actions are tracked or the “Every” counting setting is used. That is valid under Google's interaction-based definition.
The SolveIndex calculator intentionally models one counted outcome per visitor or session, so conversions greater than the denominator are rejected. The correct approach is not to force one rule on every platform; it is to understand which counting model produced the number.
GA4 Session and User Key Event Rates
Google Analytics 4 uses key events for actions that matter to the business. Its session key event rate is the percentage of sessions in which a key event occurred: sessions with a key event divided by total sessions. GA4 also provides a user key event rate based on users who performed a key event divided by total users.
This makes denominator choice explicit. If you export raw key-event counts and divide them by sessions, you may create a different metric from GA4's session key event rate because a session can trigger a key event more than once. When possible, compare native GA4 rate metrics with the same native metric over time.
Google Ads Conversion Rate
Google Ads defines conversion rate as conversions divided by eligible ad interactions, not website visitors. The interaction can be a click, view, call or another main action depending on ad format. This is why a Google Ads conversion rate should not automatically be compared with a website session conversion rate.
For paid-media economics, connect Google Ads conversion rate with CPC and CPA, then use ROAS or ROI for value and profitability. The general conversion-rate page remains focused on single-step percentage measurement rather than taking ownership of Google Ads-specific conversion reporting.
Website Conversion Rate
Website conversion rate normally describes how effectively site traffic completes a selected action. Useful segment cuts include landing page, traffic source, campaign, device, country, new versus returning users and product category. A blended site-wide percentage can hide large differences between high-intent and low-intent traffic.
When reviewing website conversion rates, keep bot filtering, consent changes, tracking configuration and traffic mix in mind. A sudden rate increase may reflect improved user experience, but it can also result from losing low-intent traffic or changing the denominator.
Conversion Rate in Marketing
In marketing, conversion rate is a bridge between traffic and outcomes. It helps answer whether a campaign or page converts attention into a defined action. It does not by itself measure acquisition cost, revenue or profit. A 5% lead conversion rate can be worse than a 3% rate if the higher-rate leads are much less qualified.
Use conversion rate alongside CPL for lead cost, CAC for new-customer acquisition cost and marketing ROI for profit context. Each metric answers a different question and should retain its own page ownership.
Single-Step Rate vs Marketing Funnel
A single conversion rate compares one starting population with one outcome. A marketing funnel measures several sequential transitions such as visitor-to-lead, lead-to-qualified, qualified-to-opportunity and opportunity-to-customer. If you need to identify where prospects are being lost across stages, use the Marketing Funnel Calculator rather than collapsing the full journey into one percentage.
Conversion Rate vs Lead-to-Customer Rate
Lead-to-customer conversion rate uses leads as the denominator and new customers as the outcome. It is a sales or closing-stage metric, so it has a dedicated Lead-to-Customer Conversion Rate Calculator. Keep that intent separate from the general visitor/session calculator.
What Is a Good Conversion Rate?
There is no universal good conversion rate. The same percentage can mean very different things for a free newsletter signup, a high-ticket B2B demo, an ecommerce checkout or a mobile app trial. Search intent, traffic source, device, geography, price, friction, brand strength and conversion definition all change the expected range.
Start with your own comparable baseline. A strong benchmark compares the same action, audience and denominator over time. External industry data is useful as context only after confirming that the sample resembles your situation.
Conversion Rate Benchmarks
Benchmark questions are popular because they provide orientation, but they are easy to misuse. “Average conversion rate” should always be followed by “for what action, channel and denominator?” Search-ad conversion rates, landing-page rates and ecommerce purchase rates are not interchangeable.
A useful benchmark table should document the year, sample size, traffic source, industry, device mix and conversion definition. SolveIndex therefore does not hard-code one universal target into the calculator. The target field is intentionally user-entered.
Sample Size and Statistical Noise
Conversion percentages can swing dramatically when the sample is small. Moving from 2 conversions to 4 conversions doubles the rate if traffic is unchanged, but that does not necessarily mean a stable performance improvement. Review absolute counts, confidence and repeated observations before reacting to a small change.
For experiments, predefine the primary metric and avoid repeatedly stopping a test when the latest percentage looks favorable. Statistical methods matter when decisions depend on small differences.
Segment Conversion Rate Before Diagnosing
Blended averages can hide the reason a rate changed. Break the result down by source, campaign, landing page, device, geography, customer type or product category. A channel mix shift can lower the overall percentage while every individual channel improves, or the reverse.
Use segments that have enough volume to interpret. Excessively narrow slices create noise and can encourage teams to optimize random variation.
Conversion Quality Matters
A conversion is valuable only if it moves the business toward the intended outcome. For lead generation, monitor qualification and lead-to-customer performance. For ecommerce, monitor revenue, contribution margin, returns and repeat purchase. For product signups, monitor activation and retention.
This is why raising the percentage alone is not the goal. The objective is more valuable conversions at sustainable economics.
Value per Conversion and Incremental Value
The calculator's optional value input translates the conversion gap into a value scenario. If 50 additional conversions are worth $120 each on average, the incremental value is $6,000. Use a defensible average and label whether the number represents revenue, gross profit, lead value or another planning estimate.
Do not call incremental conversion value profit unless the input itself reflects profit after the relevant costs. Marketing ROI and CAC are better tools when the decision is explicitly financial.
What Is Conversion Rate Optimization?
Conversion rate optimization, often abbreviated CRO and spelled conversion rate optimisation in the UK, is the structured process of improving the likelihood that eligible visitors complete a desired action. CRO combines measurement, user research, hypothesis formation, experimentation and quality checks.
CRO is broader than changing button colors. It can involve traffic intent, page speed, message clarity, form design, trust, offer structure, checkout friction and post-conversion quality. Commercial searches for CRO agencies, services and software represent separate provider/tool-selection intent and are not the primary focus of this educational guide.
How to Improve Conversion Rate
- Verify tracking before changing the experience.
- Identify the highest-volume pages or segments with meaningful friction.
- Study user intent and the questions preventing action.
- Form a specific hypothesis rather than making random design changes.
- Prioritize experiments by expected impact, evidence and effort.
- Measure downstream quality as well as the headline rate.
Semrush surfaced both “how to improve conversion rate” and “how to increase conversion rate” as substantial informational queries. The practical answer is a disciplined system, not a universal tactic.
Improve Traffic Intent and Message Match
A landing page cannot fully compensate for poorly matched traffic. Align ad copy, search intent, email promise or referral context with the page's headline, offer and next step. Excluding irrelevant traffic can increase conversion rate even when the page itself is unchanged.
Reduce Page and Form Friction
Review page speed, mobile usability, information hierarchy, form length, error handling, shipping or pricing transparency, trust signals and unnecessary steps. Remove friction that does not improve qualification or reduce risk. For high-consideration offers, adding useful information can improve qualified conversion even if the page becomes longer.
Fix Measurement Before Optimizing
Broken event tracking, duplicate tags, consent changes and mismatched attribution can create false improvements. Validate events in the analytics platform, annotate configuration changes and reconcile important conversion counts with backend or CRM records where possible.
The query “how to improve conversion rate with user session data” also highlights a useful workflow: session-level behavior can help identify friction, but it should be combined with aggregate rates and downstream outcome data rather than treated as proof on its own.
Use Controlled Experiments
When traffic allows, test meaningful hypotheses with a consistent primary conversion metric. Keep audience allocation and tracking stable, define the decision rule before reviewing results and check whether the winning variant also preserves average value, lead quality or retention.
Common Conversion Rate Mistakes
- Mixing users in one period with sessions in another.
- Counting duplicate or low-value events as though they were equivalent to primary outcomes.
- Comparing website session conversion rate directly with Google Ads interaction conversion rate.
- Using a universal benchmark without matching the conversion definition.
- Celebrating a higher rate while valuable conversion volume falls.
- Ignoring channel mix, device mix and cohort lag.
- Calling a target scenario a forecast.
- Optimizing on small samples and random variation.
Practical Conversion Rate Workflow
- Define one business outcome.
- Choose users, sessions or another eligible denominator.
- Validate tracking and deduplication.
- Calculate the current rate and absolute conversion count.
- Segment by the dimensions most likely to explain performance.
- Set a target only when it has a business and operational rationale.
- Estimate the conversion/value gap.
- Prioritize experiments using evidence.
- Measure downstream quality after changes.
- Keep a record of tracking, traffic and offer changes so comparisons remain interpretable.
Frequently Asked Questions
Sources and Methodology
SolveIndex cross-checked platform-specific conversion-rate behavior against current first-party documentation: Google Ads conversion-rate definition, Google Ads interactions, GA4 session key event rate and GA4 key events. These sources explain why denominators and counting behavior can differ by platform.
Reviewed September 10, 2026. The calculator uses transparent arithmetic and a single-count visitor/session model; it does not access analytics accounts, infer attribution or predict future conversion rates. Benchmark discussion is methodological rather than a universal performance target.
Use the Conversion Rate Calculator
Calculate website conversion percentage from your own visitors or sessions, compare a target, and estimate the conversion and value gap with the same traffic level.
Open the Conversion Rate Calculator