Cost per lead is simple arithmetic, but a useful CPL depends on a disciplined definition of both cost and lead quality. This guide explains the formula, target scenarios, benchmark context, raw-versus-qualified lead differences, downstream economics and practical ways to reduce lead cost without optimizing for low-quality volume.
What Cost Per Lead Measures
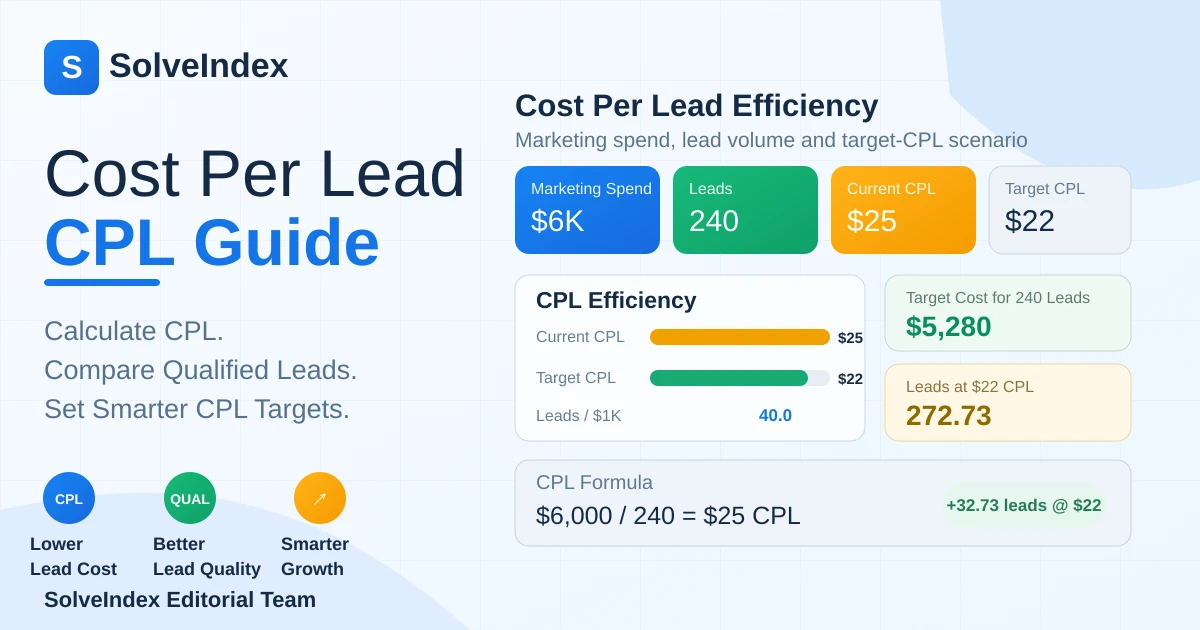
Cost per lead measures how much a defined marketing or lead-generation effort spends for each lead it produces. The basic relationship is cost divided by leads. A campaign that spends $6,000 and produces 240 leads has an average cost per lead of $25.
The metric sits between traffic metrics and customer economics. CPC measures cost to create clicks, CPL measures cost to create leads, lead-to-customer conversion measures how many leads become customers, and CAC measures the broader cost of acquiring paying customers. CPL is therefore useful, but it should rarely be managed in isolation.
What CPL Means in Marketing
In marketing, CPL stands for cost per lead. It is commonly used for lead-generation campaigns, B2B demand generation, paid search, paid social, events, content programs and other activities where a lead is a meaningful intermediate outcome before revenue.
Generic searches for the acronym CPL can have unrelated meanings, so reporting should spell out “cost per lead” at least once. The marketing interpretation also depends on the lead stage. A raw form submission, marketing-qualified lead, sales-qualified lead and booked sales conversation can each have a different CPL and a different business value.
Cost Per Lead Formula
The standard formula is total lead-generation cost divided by the number of leads generated from the same scope. HubSpot describes the same relationship as cost of lead generation divided by total leads. The numerator and denominator must cover the same campaign, channel, date range and attribution policy.
Core CPL formulas
Cost Per Lead = Marketing or Lead-Generation Cost / Leads GeneratedLeads per $1,000 = 1,000 / CPLAllowed Cost at Target CPL = Leads x Target CPLLead Capacity at Target CPL = Marketing Spend / Target CPLIf the result is $25, the average campaign spends $25 for each lead under the selected definition. That does not mean every individual lead literally costs $25; it is an average across the measured pool.
What the SolveIndex CPL Calculator Measures
The SolveIndex calculator uses three inputs: marketing spend, leads generated and an optional Target CPL. It calculates current average CPL, leads per $1,000, the cost allowance for the current lead volume at the target, the cost gap, the number of leads the current spend would support at the target CPL and the corresponding lead gap.
Target outputs are scenarios rather than forecasts. When the calculator says the same $6,000 could support 272.73 leads at a $22 CPL, it is showing arithmetic under a constant target-cost assumption. It does not predict auction prices, lead quality, conversion rates or available demand.
Which Marketing Costs Belong in CPL
For a campaign-level CPL, the numerator may be media spend or direct campaign cost. For a broader program CPL, teams may include agency fees, creative production, landing-page tools, sponsorship costs, event costs or allocated marketing technology. The right scope depends on the decision.
Label the scope instead of pretending there is only one correct numerator. “Paid media CPL” and “fully loaded lead-generation CPL” can both be valid if they are used consistently. Problems appear when one period includes only media spend and another quietly adds agency or production costs.
What Should Count as a Lead?
A lead should represent a defined person or organization that has met the criterion used in the report. Examples include a completed demo form, a pricing inquiry, a contact request, a content conversion that passes a qualification rule or a manually accepted prospect.
Do not count duplicate form submissions, test records, obvious spam or unrelated events as though they were comparable leads. If one campaign counts any email capture while another counts only sales-ready enquiries, their CPL figures answer different questions and should not be compared directly.
Raw Lead CPL vs Qualified Lead CPL
Raw-lead CPL uses all accepted lead records in the denominator. Qualified-lead CPL uses a narrower stage such as an MQL, SQL or another sales-accepted definition. Qualified CPL is usually higher because fewer records reach the denominator, but it can be more useful for revenue planning.
Google Ads now lets eligible lead-form advertisers optimize for “More volume” or “More qualified” leads. Google explicitly notes that the choice can affect both the number of leads collected and cost per lead. That is a practical reminder that a lower CPL can simply represent a different quality threshold rather than better economics.
Worked Cost Per Lead Example
Assume a lead-generation program spends $6,000 and produces 240 leads. Average CPL is $25. The campaign produces 40 leads per $1,000 of spend. If the business enters a $22 Target CPL, the same 240 leads would imply an allowed cost of $5,280, which is $720 below current spend.
The reverse scenario keeps spend fixed. At $6,000 and a $22 average CPL, the arithmetic implies 272.73 leads, or 32.73 more than the current 240. Before treating that as an opportunity, test whether lower-cost traffic can preserve qualification rate, close rate and customer value.
How to Calculate Cost Per Lead Step by Step
- Choose the campaign, channel or program you are evaluating.
- Define exactly what qualifies as a lead.
- Select one reporting period or a deliberate attribution window.
- Total the marketing or lead-generation cost that belongs to that scope.
- Count valid leads from the same scope.
- Divide cost by leads.
- Label whether the result is raw-lead CPL, MQL CPL, SQL CPL or another stage.
- Compare with historical performance and downstream customer outcomes before acting.
How to Set and Use a Target CPL
A target CPL should be derived from business economics, not copied from an unrelated industry average. Start with the customer acquisition cost the business can support, then work backward through lead-to-customer conversion and any non-marketing costs that must fit inside CAC.
For example, if a business can support $400 of CAC and 20% of qualified leads become customers, a simplistic ceiling before other acquisition costs is $80 per qualified lead. If sales and non-media costs consume part of the $400 CAC allowance, the marketing CPL target should be lower.
Calculate Allowed Spend From Target CPL
When lead volume is the fixed planning input, multiply leads by Target CPL. With 240 leads and a $22 target, the implied cost allowance is $5,280. Comparing that amount with actual spend quantifies the cost gap without assuming that lead volume will change.
This view is useful when a sales team needs roughly the same number of leads but marketing must improve cost efficiency. It is less useful when demand itself is unconstrained or when lead quality is changing materially.
Calculate Lead Capacity From Budget and CPL
When budget is fixed, divide spend by the target or expected CPL. A $10,000 budget at a $50 CPL implies 200 leads; the same budget at $40 implies 250. This is simple capacity arithmetic and is useful for scenarios, annual planning and pipeline models.
Do not assume that doubling budget preserves the same CPL. Larger spend can move into more expensive audiences, weaker intent or less efficient inventory. Use ranges and recalculate from observed performance as scale changes.
What Is a Good Cost Per Lead?
There is no universal good CPL. A $20 lead may be expensive for a low-value consumer offer and extremely attractive for a high-margin B2B contract. The right question is whether the cost produces enough qualified opportunities, customers and gross profit at an acceptable payback period.
Use your own historical lead quality and customer economics first. External averages are useful only when the industry, channel, geography, product price and lead definition are reasonably comparable.
Average Cost Per Lead
Average CPL can mean the blended average across all marketing or the average inside one channel. A blended figure is easy to track but can hide the reason performance changed. A higher-cost channel may deliver stronger qualified leads while a low-cost source contributes volume that rarely reaches sales.
Report both blended CPL and useful segments such as channel, campaign, geography, device, audience, offer and lead stage. Comparing like with like usually produces better decisions than chasing one company-wide average.
Cost Per Lead Benchmarks
Benchmark searches are useful for orientation but dangerous as automatic targets. A current HubSpot benchmark compilation reports an average B2B CPL of about $84 across channels, while channel and industry ranges vary substantially. The same source shows much cheaper email leads and much more expensive LinkedIn or high-value professional-service leads.
Treat those figures as external context, not a verdict on your campaign. Benchmark quality improves when the source documents year, sample, geography, industry, channel, lead stage and whether the metric uses ad spend only or a broader lead-generation cost.
B2B Cost Per Lead
B2B CPL is often higher than simple consumer lead generation because targeting is narrower, sales cycles are longer and lead qualification may be stricter. A high CPL can still be efficient when contract value, margin, close rate and retention support the cost.
For B2B reporting, pair CPL with MQL-to-SQL rate, SQL-to-opportunity rate, lead-to-customer rate, CAC and pipeline value. That prevents marketing from optimizing for form fills that sales does not consider useful.
Cost Per Lead by Industry
Industry changes the economics behind lead cost. Legal, finance, enterprise software and other high-value categories can tolerate more expensive leads than low-ticket offers. Competitive search auctions and narrow professional audiences can also raise paid-media CPL even when the resulting customers are profitable.
When using a cost-per-lead-by-industry table, check whether the benchmark is B2B or B2C, which countries it covers, the lead stage and the acquisition channel. “Average cost per lead by industry” without those details is usually too broad for target setting.
Cost Per Lead by Channel
Search, social, email, content, events, affiliates and outbound programs can produce very different CPLs because the audience intent and cost structure differ. Search may be expensive but high intent; content can look inexpensive after it scales but requires production and time; events can have high direct cost while producing strategically valuable accounts.
Do not force every channel to the same target CPL. Compare each source with its own lead quality, close rate and customer value, then use blended CPL for portfolio-level planning.
Google Ads Cost Per Lead and Lead Quality
In Google Ads lead-generation campaigns, CPL depends on click cost, conversion rate, targeting, auction competition, form friction and lead definition. A lower cost per lead can come from cheaper clicks, higher form completion or broader traffic, but those changes can have different effects on downstream quality.
Google’s lead-form documentation explicitly offers “More volume” and “More qualified” optimization. More volume can reduce friction and produce more leads, while more qualified adds steps and may produce fewer but more interested prospects. Google notes that this choice can affect CPL and lead count, reinforcing why cost and quality must be read together.
Why Lead Quality Matters More Than Cheap CPL
A campaign can improve CPL while making the business worse. If a cheaper audience produces many weak leads, sales spends more time filtering them, close rate falls and CAC can rise. The apparent top-of-funnel efficiency is then misleading.
Track at least one downstream quality signal with CPL: qualification rate, meeting rate, opportunity rate, customer conversion, revenue, gross profit or another outcome tied to the business. The exact metric depends on the funnel, but the principle is consistent.
CPL vs CPA
CPL always uses a lead as the measured outcome. CPA is broader and can mean cost per action or cost per acquisition, depending on the platform and reporting convention. A CPA conversion could be a signup, purchase, booked call or lead.
If the conversion action is specifically a lead, advertising CPA and CPL may be numerically similar. Keep the labels separate when the action changes. SolveIndex’s CPA calculator is designed for generic selected conversion actions, while this CPL page owns lead-generation cost intent.
CPL vs Customer Acquisition Cost
CPL stops at the lead stage. CAC uses new paying customers and often includes a broader set of sales and marketing acquisition costs. A campaign can have a strong CPL and weak CAC if few leads become customers, while a higher CPL can still support an excellent CAC when close rate and customer quality are strong.
Use the CAC calculator when the denominator is new customers. Use CPL when the denominator is leads. The distinction keeps marketing and finance discussions aligned around the same funnel stage.
CPL and Lead-to-Customer Conversion Rate
CPL and lead-to-customer rate combine into a simple bridge toward customer cost. If lead generation costs $40 per lead and 20% of those leads become customers, marketing-only cost per customer is roughly $200 before sales and other acquisition costs.
This relationship is why a Target CPL should not be set without conversion context. If qualification rules change and lead-to-customer conversion falls, the same CPL target may no longer support the same CAC.
CPL, Customer Value and Unit Economics
The business value of a lead ultimately depends on what happens after the lead is created. Expected customer value, contribution margin, retention and payback determine how much the company can afford to spend on the funnel.
A rational CPL target therefore flows backward from customer economics. High-margin, high-retention customers can justify more expensive leads than one-time low-margin buyers, even when both campaigns produce the same number of leads.
How to Lower Cost Per Lead
Reduce CPL by improving the economics of traffic acquisition, conversion and qualification rather than simply removing friction everywhere. Useful levers include tighter targeting, stronger offer-message match, more relevant keywords, better creative, faster landing pages, clearer forms, improved lead routing and removal of low-quality placements.
Measure the effect on qualified leads and customers after each change. A genuine CPL improvement lowers cost while preserving or improving the downstream value of the lead pool.
Improve Targeting and Message Match
Poor targeting wastes spend before the form is ever reached. Separate high-intent and exploratory audiences, exclude irrelevant queries or placements where appropriate, align creative with the search or audience intent, and send visitors to a landing page that matches the promise in the ad.
Better message match can improve lead conversion without necessarily lowering click cost. The objective is not only to generate more form submissions, but to attract people who reasonably fit the offer.
Reduce Form Friction Without Destroying Lead Quality
Shorter forms can increase lead volume, but every removed field also removes information that may help qualification. Test form length against downstream outcomes instead of assuming that the highest completion rate is best.
For high-volume campaigns, consider progressive qualification, confirmation steps or qualifying questions where the platform supports them. Google Ads qualifying responses are specifically designed to collect intent and readiness information before submission, which can improve the usefulness of the resulting lead pool.
Fix Lead Tracking and Deduplication
Bad tracking can make CPL appear better or worse without any real change in performance. Deduplicate repeated submissions, remove test and spam records, keep UTM and offline-source mapping consistent, and reconcile lead counts between advertising platforms, analytics tools and the CRM.
Document attribution windows and late-arriving offline leads. A lead reported in the CRM several days after the click may not line up neatly with a daily platform report, so use a consistent close-out process before comparing periods.
Common Cost Per Lead Mistakes
- Mixing ad spend from one scope with leads from another.
- Comparing raw-lead CPL with qualified-lead CPL without labeling the difference.
- Counting duplicates, spam or test submissions as leads.
- Using a universal industry benchmark as an automatic target.
- Celebrating lower CPL while lead-to-customer conversion deteriorates.
- Ignoring agency, event or production costs when the decision requires a broader cost view.
- Calling a target scenario a forecast.
- Assuming CPL scales linearly as budget increases.
- Comparing channels with completely different intent and lead stages.
- Optimizing marketing CPL without checking CAC and customer value.
Practical CPL Reporting Workflow
- Define the lead stage and valid-lead rules.
- Choose a campaign, channel or program scope.
- Collect matching lead-generation cost and lead count.
- Calculate current CPL and leads per $1,000.
- Segment by channel, campaign, geography or audience where the sample allows.
- Connect each segment with qualification and customer conversion.
- Set Target CPL from CAC and customer economics.
- Run target-cost and lead-capacity scenarios.
- Test one practical efficiency lever at a time.
- Recalculate after material tracking, channel or qualification changes.
Frequently Asked Questions
Sources and Methodology
SolveIndex cross-checked the CPL formula and benchmark context against HubSpot's Cost Per Lead guide and its current CPL/CAC benchmark research. Lead-quality behavior was checked against Google Ads lead-form optimization and Google Ads qualifying responses.
Reviewed September 12, 2026. The calculator uses transparent arithmetic and does not access ad accounts, CRM systems or analytics data. External benchmark numbers are context only; the user-entered Target CPL remains the planning threshold.
Use the Cost Per Lead Calculator
Calculate current CPL, compare a Target CPL, and quantify same-spend lead capacity with your own numbers.
Open the Cost Per Lead Calculator