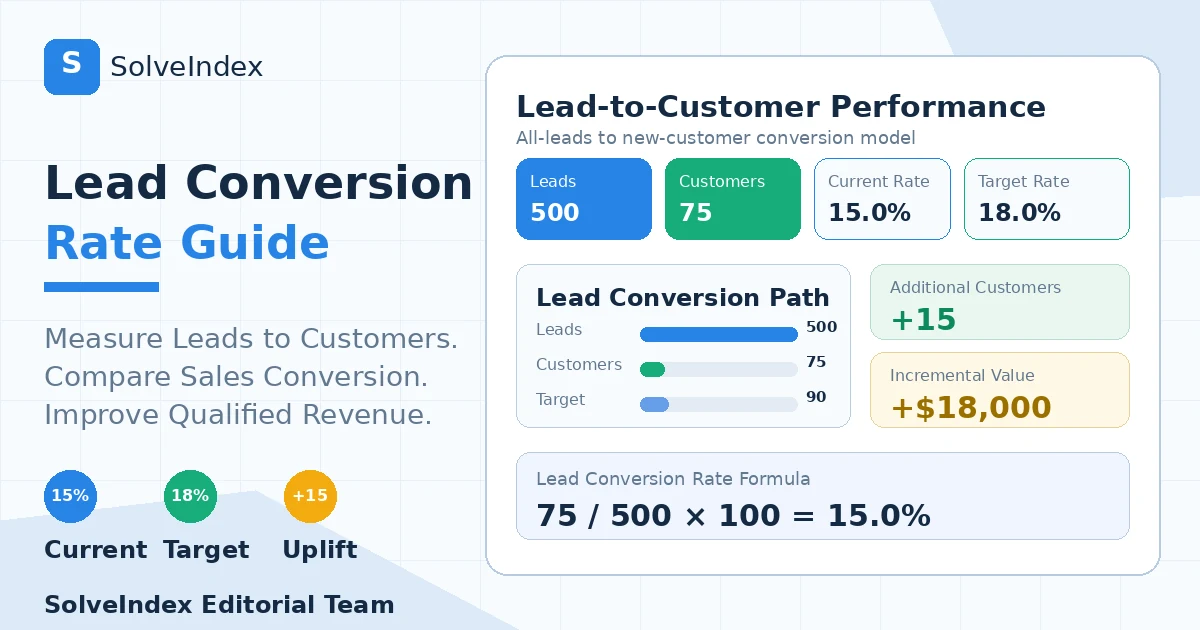
Lead conversion rate measures how efficiently a defined pool of leads becomes customers or another clearly defined downstream outcome. For this guide, the primary model is new customers divided by leads, which is also called lead-to-customer conversion rate and, in many sales teams, sales conversion rate.
What Lead Conversion Rate Measures
Lead conversion rate measures the share of leads that complete the outcome you define as a conversion. In a lead-to-customer model, a conversion is a new customer, so the rate answers a direct commercial question: of the leads entering the measured process, what percentage eventually became customers?
The numerator and denominator matter more than the label. Salesforce notes that a converted lead often means a paying customer, but some organizations use the term for a lead that becomes an opportunity, starts a paid trial or signs a contract. That means two dashboards can both show “lead conversion rate” while measuring different stages. Label the outcome and lead population explicitly before comparing the percentage.
Lead Conversion Rate Formula
When the conversion outcome is a new customer, divide the number of new customers by the number of leads from the same cohort or reporting scope, then multiply by 100.
Core formulas
Lead-to-Customer Conversion Rate = New Customers / Leads x 100Customers at Target Rate = Leads x Target RateLeads Needed for Customer Goal = Customer Goal / Target Rate as a DecimalAdditional Customers = Target Customers - Current CustomersIncremental Customer Value = Additional Customers x Value per CustomerIf 75 customers come from 500 leads, the lead conversion rate is 15%. This is the same arithmetic Salesforce uses in its lead-conversion and sales-conversion guidance when the denominator is leads and the outcome is customers or sales.
What Counts as a Converted Lead?
For this SolveIndex calculator, a converted lead means a new customer. That keeps the numerator tied to a commercial outcome and avoids mixing intermediate funnel events with closed business. If your CRM uses “converted lead” to mean an opportunity, MQL-to-SQL transition or another internal status, do not place that number into this customer model without relabeling the metric.
A useful reporting definition states both sides of the ratio, for example “new customers from marketing-qualified leads” or “closed-won customers from all inbound leads.” This prevents a higher conversion rate caused only by narrowing the denominator from being mistaken for better sales execution.
Lead Conversion Rate vs Sales Conversion Rate
“Sales conversion rate” is often used for the same leads-to-sales calculation. Salesforce describes sales conversion rate as sales divided by leads, multiplied by 100. In that definition, sales conversion rate and lead-to-customer conversion rate can be equivalent when one closed sale corresponds to one new customer and both calculations use the same lead pool.
However, sales teams also calculate conversion at opportunity, proposal and negotiation stages. An opportunity-to-closed-won rate should not be compared directly with an all-leads-to-customer rate because the opportunity denominator has already passed qualification. Use the phrase that matches your denominator rather than forcing every sales percentage into one benchmark.
Worked Lead-to-Customer Conversion Example
Suppose a business records 500 leads and 75 new customers from the same mature cohort. The lead-to-customer conversion rate is 75 / 500 x 100 = 15%. There are 425 leads that did not become customers, and the business used about 6.67 leads per new customer.
If the team sets an 18% planning target, 500 leads would imply 90 customers at the same lead volume. That is 15 more customers than the current result. If the planning value per new customer is $1,200, the incremental customer-value scenario is $18,000. The Lead Conversion Rate Calculator reproduces these default values.
| Metric | Current | Target scenario |
|---|---|---|
| Leads | 500 | 500 |
| New customers | 75 | 90 |
| Lead conversion rate | 15% | 18% |
| Additional customers | - | 15 |
| Incremental value at $1,200/customer | - | $18,000 |
Unconverted Leads and Leads per Customer
The headline rate is easier to interpret when you also show the absolute counts. Unconverted leads equal leads minus new customers. Leads per customer equal leads divided by customers. A 15% rate means roughly 6.67 leads are needed for each customer under the observed mix; it does not mean the next 6.67 leads will reliably produce one customer.
These supporting measures help teams distinguish a percentage improvement from a volume change. A rising rate with sharply fewer leads can still produce fewer customers, while a slightly lower rate on a much larger, still-profitable lead pool may produce more revenue.
How to Use a Target Lead Conversion Rate
A target lead conversion rate should be grounded in your own lead source mix, qualification stage, sales capacity, pricing and historical performance. The target field in the calculator is a scenario input: it shows what the same lead volume would produce if the entered rate were achieved. It does not forecast that the target is attainable.
Use targets as operating ranges rather than universal pass/fail thresholds. If your lead definition becomes stricter, the rate can rise even if the underlying demand and selling process are unchanged. Record major lead-definition changes beside the target so historical comparisons remain interpretable.
How Many Leads Do You Need for a Customer Goal?
You can reverse the formula for capacity planning. Divide the desired number of new customers by the expected lead-to-customer rate expressed as a decimal. If the goal is 100 customers and the expected rate is 20%, the implied lead requirement is 500. At a 15% rate, the same 100-customer goal needs about 667 leads.
Reverse planning is useful for marketing and sales alignment, but it inherits the quality of the conversion assumption. Adding lead volume can change source mix, response times and sales capacity, so the existing rate may not remain constant at a larger scale.
Lead Cohorts and Sales-Cycle Timing
Lead-to-customer rate can be distorted when the numerator and denominator come from different generations of leads. In a long sales cycle, customers closed this month may have entered the funnel several months ago. Dividing them by this month's newly generated leads creates a convenient period ratio, but not a true cohort conversion rate.
For longer B2B cycles, cohort reporting is usually more informative: group leads by the date or period they entered the measured stage and follow that group until enough time has passed for outcomes to mature. Compare cohorts at similar ages so an immature cohort is not judged against one that has had a full quarter to close.
Raw Leads vs MQLs, SQLs and Opportunities
A raw lead, marketing-qualified lead (MQL), sales-qualified lead (SQL) and opportunity represent different levels of buying intent. Their customer conversion rates should normally increase as qualification becomes stricter because each downstream denominator contains fewer, more qualified prospects.
This is why benchmark questions need a stage label. “Average lead conversion rate” is ambiguous unless you know whether the denominator is every captured lead, only qualified leads or active opportunities. Use the Marketing Funnel Calculator when you need separate rates for several sequential stages instead of collapsing the entire middle funnel into one ratio.
How Lead Quality Changes Conversion Rate
Lead quality is one of the strongest drivers of conversion. A campaign can increase lead volume while reducing the share of prospects who have the right need, budget, authority or timing. That can lower lead conversion rate even when sales execution is stable. The reverse can happen when marketing narrows targeting and sends fewer but better-qualified leads.
Judge conversion rate alongside absolute customers, customer value and acquisition cost. A higher rate is useful only when the leads and resulting customers are valuable enough to support the business objective.
Lead Source and Channel Segmentation
Blended conversion rate can hide large differences between referral, paid search, organic search, webinars, outbound prospecting, partner leads and paid social. Segment by source when sample sizes are adequate and your attribution rules are stable. This shows whether the overall rate changed because a channel improved or because the mix shifted toward a different type of lead.
When comparing channels, keep the qualification rule and customer outcome consistent. A source that sends fewer leads at a higher CPL can still be more efficient if its lead-to-customer rate is materially stronger and its customers have higher value.
B2B Lead Conversion Rates
B2B funnels often have more stages, longer sales cycles and smaller sample sizes than simple transactional funnels. That makes cohort maturity and denominator choice especially important. “Average B2B lead conversion rate” can refer to raw-lead-to-customer, MQL-to-customer, SQL-to-customer or opportunity-to-win performance, which are not interchangeable.
For B2B reporting, publish the stage with the percentage. For example: “SQL-to-customer conversion rate: 24% for cohorts at least 120 days old.” That statement is far more actionable than an unlabeled 24% sales conversion rate.
Average Lead Conversion Rate and Benchmarks
There is no reliable universal average lead conversion rate for every business. HubSpot's current lead-conversion guidance notes that conversion can occur at multiple stages and recommends granular comparisons by channel or stage rather than relying on one industry-wide number. Differences in lead definition, source, price, sales cycle and qualification can overwhelm a generic benchmark.
Use external benchmarks as directional context, then anchor targets in your own mature cohorts. A useful benchmark table should include the denominator stage, conversion outcome, industry or customer segment, acquisition channel, time period and sample size.
What Is a Good Lead Conversion Rate?
A good lead conversion rate is one that produces enough valuable customers at sustainable acquisition economics for the specific lead stage you measure. A 10% rate from broad top-of-funnel leads can be stronger than a 30% rate from heavily screened opportunities if the first system produces more profitable customer volume.
Evaluate the rate with CPL, CAC, sales capacity, customer value and retention. The right question is not only “is the percentage high?” but “does this lead system create enough high-quality customers at an acceptable cost?”
Sample Size, Volatility and Trend Analysis
Small lead pools can create large percentage swings. Moving from three customers to five out of 20 leads changes the rate from 15% to 25%, but the sample is still small. Avoid treating every short-term movement as a process improvement or failure.
Track the numerator and denominator with the percentage, compare consistent windows, and use longer rolling or cohort views when volume is low. Annotate pricing, routing, qualification, staffing and campaign changes that may explain a break in the trend.
Lead Conversion Rate vs Close Rate and Win Rate
Close rate is an overloaded term. Some teams use it as customers divided by all leads, in which case it matches lead-to-customer rate. Other teams use closed-won deals divided by opportunities or proposals. Win rate is also commonly opportunity-based. The formula can look similar while the denominator changes dramatically.
If you search for how to calculate close rate, first identify the population being closed. Use lead conversion rate for all leads to customers. Use opportunity-to-customer or win rate for qualified deals. Keeping these definitions separate prevents inflated comparisons.
Speed to Lead and First Response
Lead conversion can deteriorate when interested prospects wait too long for a relevant response, particularly for high-intent inbound leads. Track response time by channel and lead priority, but evaluate it together with lead quality and workload. Faster handling is useful when the response is accurate and reaches the right prospect.
Do not treat response speed as the only lever. A fast response to poorly targeted leads can increase activity without increasing customers. Pair speed metrics with contact rate, qualification, meeting rate and downstream customer conversion.
Lead Routing and Ownership
Routing errors create silent conversion loss: duplicate ownership, leads assigned to unavailable reps, wrong territory rules or unclear handoffs can delay follow-up. Build auditable ownership rules and track whether high-intent leads reach an accountable person quickly.
Segment conversion rate by owner or team only when lead mix is comparable. A representative working a more difficult segment may have a lower raw rate while still performing well relative to the leads assigned.
Follow-Up Cadence and Sales Process
A consistent follow-up process reduces leads that disappear simply because no next step was scheduled. Track stage progression, contact attempts and reasons for disqualification. The goal is not maximum activity; it is a process that helps qualified leads make an informed buying decision and gives the team clear evidence about why leads do not convert.
Review drop-off reasons separately from the headline rate. Pricing, product fit, timing, competition and unreachable leads require different responses. A single conversion percentage cannot diagnose all of them.
Marketing and Sales Handoff
Lead conversion depends on both the quality of demand created by marketing and the sales process that handles it. Agree on what constitutes a lead, MQL, SQL and accepted opportunity, and define the point at which ownership transfers. This reduces situations where marketing counts volume that sales does not consider actionable.
A shared funnel report should show volume, conversion rates and aging at each stage. That makes it easier to distinguish a lead-generation problem from a qualification, routing or closing problem.
How to Convert Leads to Sales
Improving leads-to-sales conversion starts with diagnosis rather than one generic tactic. Check whether the lead matches the ideal customer profile, whether the source promise matches the sales offer, whether the lead reached the correct owner, whether follow-up occurred promptly, and whether objections are being recorded in a usable way.
Then improve the specific weak point: refine targeting for quality problems, clarify qualification criteria for handoff problems, improve routing for operational delays, strengthen discovery for fit problems, or improve proof and offer clarity when qualified prospects stall late in the process.
How to Improve Sales Conversion Rate
To improve sales conversion rate without sacrificing customer quality, test changes at one stage at a time and monitor downstream outcomes. Useful levers include tighter ICP targeting, lead scoring, faster routing, clearer follow-up ownership, sales enablement, objection analysis, relevant case studies, better qualification and removing unnecessary friction in the buying process.
Measure the effect in customer count and economics, not percentage alone. A change that increases close rate but also increases discounts, churn or sales effort may not improve the business outcome.
Relationship With Cost per Lead (CPL)
CPL measures what it costs to create the lead pool. Lead conversion rate measures how much of that pool becomes customers. If the cost basis is the same, a simple media-level relationship is: approximate cost per customer = CPL / lead-to-customer rate as a decimal. For example, a $40 CPL and a 20% lead-to-customer rate imply about $200 of lead-generation cost per customer before broader sales and acquisition expenses.
Use the CPL Calculator for lead cost. Do not interpret a cheaper CPL as automatically better if those leads convert to customers at a much lower rate.
Relationship With Customer Acquisition Cost (CAC)
CAC divides the acquisition costs included in your policy by new customers. Lead conversion rate helps explain one of the operational drivers of CAC: how many leads are needed to create each customer. If conversion improves while lead costs and broader acquisition costs stay stable, CAC may improve.
The CAC Calculator can include marketing, sales and other acquisition costs, so it is broader than a lead-to-customer percentage. Keep cost scope and customer scope aligned when connecting the two metrics.
Customer Value, Revenue and Conversion Quality
The calculator's optional value-per-customer input translates a target conversion gap into a value scenario. It does not prove the additional customers will have the same revenue, margin or lifetime value as current customers. If the lead mix changes, customer quality can change too.
Monitor order value, contract value, margin, retention and expansion when they are material to the business. A lower conversion rate can be acceptable if the resulting customers are more valuable and profitable.
Lead Conversion Reporting Workflow
- Define the lead stage and the exact customer outcome.
- Choose a period-based or cohort-based method that fits the sales cycle.
- Count leads and new customers from the same scope.
- Calculate the rate and supporting absolute counts.
- Segment by source, qualification level, market or owner where sample sizes permit.
- Compare mature cohorts with prior periods using the same definitions.
- Connect the rate with CPL, CAC and customer value.
- Investigate the largest meaningful bottleneck and record the change you test.
This workflow keeps the metric auditable. It also prevents a benchmark from becoming the objective when the real objective is profitable customer growth.
Common Lead Conversion Rate Mistakes
- Dividing customers from old lead cohorts by newly generated leads without labeling the approximation.
- Comparing all-leads conversion with SQL or opportunity conversion as if the denominators were equivalent.
- Changing the definition of a qualified lead without annotating the reporting change.
- Using duplicate, spam or ineligible leads in one period but excluding them in another.
- Calling opportunity win rate a lead conversion benchmark.
- Optimizing percentage while total customers, customer value or margin decline.
- Comparing channels without accounting for different lead intent and qualification rules.
- Using a small sample to declare a major improvement from a few additional wins.
Frequently Asked Questions
Sources and Methodology
SolveIndex cross-checked the terminology in this guide against current Salesforce and HubSpot material. Salesforce Lead Conversion describes lead conversion rate as converted leads divided by total leads and notes that the conversion outcome can vary by business. Salesforce Sales Conversion Rate uses sales divided by leads when measuring sales conversion. HubSpot Lead Scoring uses new customers divided by leads as a lead-to-customer benchmark, and HubSpot's 2026 CRO guide uses lead-to-customer close rate for reverse lead-goal planning.
Reviewed September 11, 2026. SolveIndex does not publish one universal lead-conversion benchmark because stage definitions, industries, lead sources and sales cycles differ materially. Calculator scenarios are arithmetic planning models based on the values you enter, not forecasts of future sales performance.
Use the Lead Conversion Rate Calculator
Calculate your leads-to-customers rate, compare a target, and estimate the customer and value gap while keeping the lead definition consistent.
Open the Lead Conversion Rate Calculator