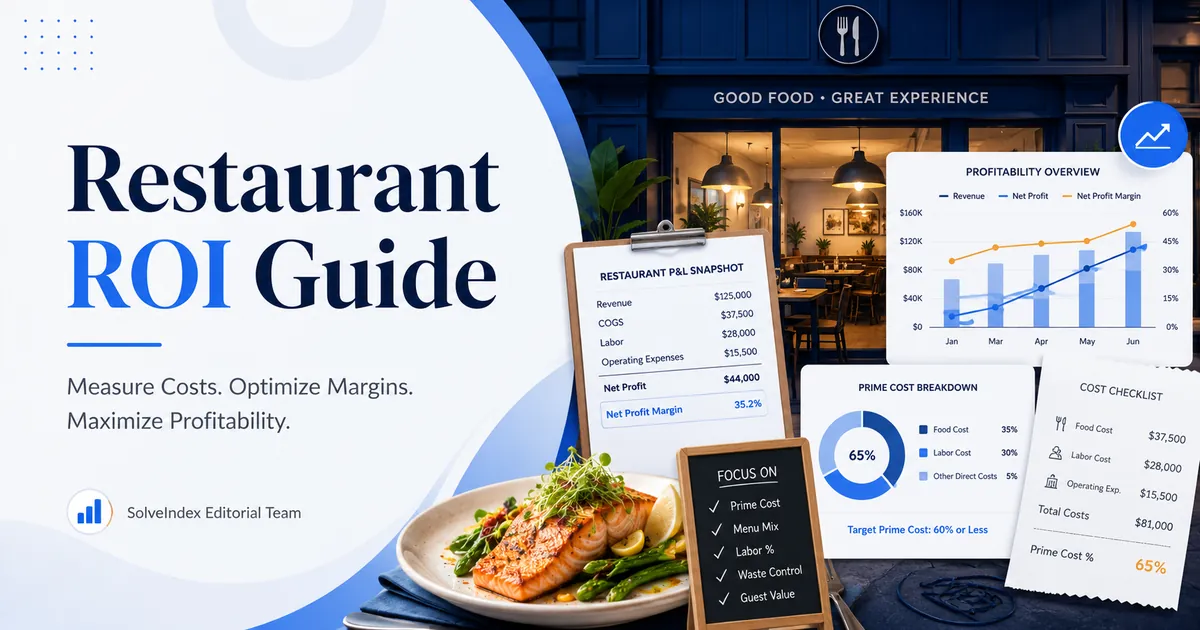
Restaurant ROI connects startup capital with recurring operating profit. A useful calculation must include the revenue and cost structure that actually produces that profit, not sales alone.
This guide explains restaurant profit, food cost, labor cost, prime cost, startup investment, annual ROI, payback and break-even concepts for full-service, limited-service, fast-casual, cafe, bakery, catering, takeaway and delivery-focused businesses.
What This Restaurant Profit and ROI Calculator Measures
The SolveIndex restaurant calculator is an operating and startup-investment screening tool. It combines equipment and buildout investment with average monthly sales and major operating cost categories. It then estimates food cost percentage, labor cost percentage, prime cost percentage, total monthly operating costs, monthly operating profit, profit margin, annualized profit, annual ROI and the number of profitable months required to recover the entered startup investment.
The model does not replace a restaurant income statement, cash-flow forecast or lender model. It does not automatically calculate debt payments, income tax, depreciation, owner distributions, working-capital changes, sales tax, equipment replacement or the timing of opening losses. Add material costs to the available fields and use a separate monthly cash-flow model for financing and liquidity decisions.
Restaurant ROI, Profit Margin and Payback Formulas
All inputs should use one currency and comparable periods. Monthly sales and operating costs should represent the same month or the same normalized monthly forecast.
Worked Restaurant ROI Example
A fast-casual concept enters $80,000 for equipment and kitchen technology and $180,000 for buildout and other opening costs. Total entered startup investment is $260,000. Monthly sales are $75,000. Food and beverage cost is $24,000, labor is $22,500, occupancy and utilities are $8,500, marketing and delivery commissions are $2,500, and other operating costs are $3,000.
Total monthly operating costs are $60,500, leaving $14,500 in estimated monthly operating profit. Food cost is 32%, labor cost is 30%, prime cost is 62%, and profit margin is 19.3%. Annualized profit is $174,000. Dividing that result by the $260,000 entered startup investment produces an estimated annual ROI of 66.9%. Dividing startup investment by monthly profit produces an estimated payback of 17.9 profitable months.
| Input or result | Amount |
|---|---|
| Equipment and kitchen | $80,000 |
| Buildout and opening cost | $180,000 |
| Monthly sales | $75,000 |
| Food cost | $24,000 (32%) |
| Labor cost | $22,500 (30%) |
| Prime cost | $46,500 (62%) |
| Total monthly costs | $60,500 |
| Monthly operating profit | $14,500 |
| Annual ROI | 66.9% |
| Payback | 17.9 months |
Build a Complete Restaurant Startup Investment
Startup investment can include commercial kitchen equipment, refrigeration, ventilation, dishwashing, furniture, POS systems, smallwares, signage, construction, plumbing, electrical work, permits, design, deposits, professional fees, opening inventory, pre-opening payroll, staff training, launch marketing and technology setup. The current calculator provides two startup fields, so combine related items rather than omitting them.
The U.S. Small Business Administration recommends identifying startup expenses before launch because complete estimates support funding requests, profit planning and break-even analysis. A restaurant can appear to have excellent ROI when deposits, pre-opening losses, working capital or required renovation are left outside the denominator.
Separate Working Capital From Equipment and Buildout
Equipment and buildout are long-lived startup investments. Working capital is the cash needed to pay suppliers, payroll, rent, utilities and other obligations while sales ramp up or cash receipts are delayed. A complete financing plan should show both.
The calculator can include a working-capital allowance inside the buildout and other opening-cost field for a broader payback comparison. However, keep a separate cash schedule so decision-makers can see when funds are needed and whether the business has enough liquidity during opening months.
Forecast Monthly Restaurant Sales by Channel
Include dine-in, takeaway, drive-through, catering, private events, delivery, merchandise and other recurring operating sales. Exclude sales tax collected for government, employee gratuities and refundable deposits. If third-party delivery statements report revenue after commissions, do not deduct the same commission again.
For a new concept, build sales from operating days, seats, table turns, average guest spend, takeaway orders, delivery orders and catering activity. Test an opening-ramp scenario instead of assuming mature sales from the first month.
How to Calculate Restaurant Food Cost Percentage
Food cost percentage compares food, beverage, packaging and product waste with restaurant sales for the same period. The calculator uses the entered monthly cost directly. An accounting food-cost calculation may also reconcile beginning inventory, purchases and ending inventory.
Rising food cost can reflect supplier prices, poor portion control, inaccurate recipes, inventory errors, spoilage, theft, discounts or an unfavorable sales mix. Review food cost by menu category and compare actual plate cost with the price and contribution generated by each item.
Use Menu-Item Food Cost for Pricing Decisions
Whole-restaurant food cost explains the combined result. Menu-item food cost shows whether a specific dish or beverage produces enough contribution to cover labor, occupancy and overhead. Calculate recipe cost from the current quantity and price of every ingredient, then include garnish, packaging and expected waste where material.
A low food-cost percentage does not automatically make an item attractive if it sells rarely or requires excessive preparation. Review item contribution, popularity, preparation time and capacity together.
How to Calculate Restaurant Labor Cost Percentage
Labor cost should include hourly wages, salaries, management compensation, employer payroll taxes, benefits, overtime, bonuses and paid contractor labor. Include realistic owner compensation when an owner performs management, kitchen or service work that would otherwise require paid staff.
High labor percentage can be caused by excessive hours, but it can also result from weak sales. Analyze scheduled versus actual hours, sales per labor hour, overtime, turnover, training time and staffing by daypart before cutting positions that protect service quality.
What Restaurant Prime Cost Shows
Prime cost combines food, beverage, packaging and labor. These costs usually move with operating volume and receive frequent management attention, so the metric is useful for detecting margin pressure quickly.
Do not treat one prime-cost percentage as a universal rule. A full-service restaurant, quick-service concept, cafe, bakery, catering operation and delivery kitchen can support different cost mixes. Compare with similar operators and track the direction of your own ratio over time.
Include Occupancy and Utility Costs
Occupancy can include base rent, common-area maintenance, property tax pass-throughs, insurance obligations and other lease charges. Utilities can include electricity, gas, water, waste, internet and recurring equipment-related energy use. Read the full lease rather than using advertised base rent only.
High-volume locations may support a larger absolute rent while maintaining an acceptable occupancy ratio. A cheaper location can still be uneconomic if weak visibility or demand limits sales.
Account for Delivery Commissions, Discounts and Loyalty Rewards
Delivery channels can add sales while reducing the contribution earned on each order. Include commissions, sponsored placement fees, refunds, chargebacks, packaging and channel-specific discounts whenever those costs are not already netted from recorded sales.
Discounts and loyalty rewards should be treated consistently. Do not report full menu price as revenue while also ignoring the promotion that reduced the cash collected.
Include Card Fees, Software, Repairs and Other Overhead
Other restaurant operating costs may include payment processing, reservation and POS software, accounting, legal services, insurance, licenses, music fees, linen, cleaning, pest control, routine maintenance, office supplies, security and small equipment replacement.
Irregular but predictable costs can be converted into a monthly reserve. Estimate the annual amount and divide it by 12 so a quiet month does not make normal profitability look artificially high.
Calculate Monthly Restaurant Profit and Profit Margin
Monthly operating profit is sales minus the operating costs entered. Profit margin expresses that amount as a percentage of sales. The calculation is useful for scenario comparison, but the label should not be confused with audited net income when tax, depreciation, financing and other items are excluded.
Use average or normalized months for planning. Annualizing a peak month can substantially overstate restaurant ROI, while using an opening month can understate the performance of a mature concept.
Calculate Annual Restaurant ROI
The calculator multiplies monthly operating profit by 12 and divides annualized profit by equipment plus buildout and other entered opening cost. A positive ROI means the model produces profit relative to that investment under the entered assumptions.
ROI does not show the timing of individual cash flows or the amount of cash available for debt service. Larger projects and acquisition decisions may require monthly forecasts, discounted cash flow, lender coverage tests and tax analysis.
Calculate Restaurant Investment Payback
Payback divides entered startup investment by monthly operating profit. It answers how many equally profitable months are required to recover the investment. When monthly profit is zero or negative, positive payback is unavailable.
Compare payback with lease length, renewal options, equipment life, financing obligations and expected remodeling needs. A short calculated payback is not useful when the assumed monthly profit cannot be sustained.
Calculate Restaurant Break-Even Sales Separately
Operating break-even occurs when total revenue equals fixed and variable operating costs. The SBA expresses break-even sales dollars as fixed costs divided by contribution margin. This requires separating costs that change with sales from costs that remain relatively fixed.
The current restaurant ROI calculator accepts dollar costs rather than per-unit contribution assumptions, so it does not automatically calculate break-even sales. Use its monthly profit output for scenario testing and a dedicated contribution-margin model for formal break-even analysis.
Restaurant Break-Even and Investment Payback Are Different
A restaurant can reach monthly operating break-even as soon as sales cover current monthly costs. Startup investment payback occurs only after accumulated positive profit has recovered equipment, buildout and other opening capital.
Investors and lenders may need both measures: break-even shows the sales target required to avoid an operating loss, while payback shows how long startup capital remains exposed.
Use Contribution Margin for Sales and Break-Even Decisions
Contribution margin is sales minus costs that vary directly with sales. At a menu-item level, contribution can be price minus ingredient, packaging, delivery and other directly variable costs. At a restaurant level, the exact classification depends on the business model.
Contribution analysis helps evaluate promotions, delivery channels and menu mix. A high-revenue channel can reduce overall profit when its variable commissions and fulfillment costs are too high.
Run Conservative, Expected and Stronger Restaurant Scenarios
A useful restaurant investment model should not depend on one sales forecast. In a conservative scenario, reduce sales, increase food and labor costs, and add opening inefficiency or repair reserves. The expected scenario should use the most defensible assumptions. A stronger case can test upside without becoming the approval baseline.
Compare monthly profit, margin, annual ROI and payback across all scenarios. Identify which assumptions change the decision most and define operational actions for those risks.
Model Opening Ramp-Up and Seasonality
New restaurants may require time to build awareness, train staff and stabilize recipes, inventory and schedules. Seasonal locations can also experience large differences between peak and low months. Annualizing one month hides these patterns.
Create a 12-month schedule when sales, labor or utilities vary materially. The calculator remains useful for testing each representative month, but a cash-flow forecast is needed to see cumulative losses, funding needs and the timing of payback.
Evaluate Commercial Kitchen Equipment ROI
Equipment ROI can come from lower energy use, reduced maintenance, less food waste, higher throughput, improved consistency or fewer labor hours. Compare purchase, installation and training cost with measurable annual operating savings or additional contribution profit.
ENERGY STAR states that a suite of certified commercial foodservice equipment could save about $4,000 per year, but actual results depend on equipment type, usage, local utility rates and the equipment being replaced. Use equipment-specific estimates and operating hours.
Compare Restaurants With Similar Service Models
Full-service restaurants often require more front-of-house labor, table service and broader menus. Limited-service concepts may have different labor, packaging, throughput and delivery economics. Cafes, bakeries, catering businesses and bars also have distinct cost structures.
Benchmark comparisons are most useful when service format, annual sales, average check, location, community size and sales mix are similar.
| Restaurant model | Cost issues to review | ROI sensitivity |
|---|---|---|
| Full service | Front-of-house labor, table turns, reservations and broad menu complexity | Guest traffic, average check, labor scheduling and occupancy |
| Limited service / QSR | Throughput, packaging, delivery, drive-through and equipment capacity | Transaction volume, speed, food waste and labor productivity |
| Cafe or bakery | Morning demand, perishability, beverage mix and production labor | Daypart sales, waste, rent and average transaction value |
| Catering or events | Event labor, transport, rentals, deposits and irregular demand | Booking pipeline, event contribution and capacity utilization |
Use Restaurant Food-Cost Benchmarks Carefully
The National Restaurant Association reported 2024 median food and non-alcohol beverage cost of 32.0% of sales for surveyed full-service restaurants and 32.4% for surveyed limited-service restaurants. The Association explicitly states that these figures are management comparison tools rather than standards or goals for individual restaurants.
Food costs vary with menu, alcohol mix, purchasing scale, waste, location and pricing. Use current supplier invoices and inventory records for decision-making.
Use Restaurant Labor-Cost Benchmarks Carefully
The same 2025 Operations Data Abstract reported 2024 median salary, wage and benefit ratios of 36.5% for surveyed full-service operators and 31.7% for surveyed limited-service operators. Profitable and loss-making respondents showed materially different labor ratios.
These figures should prompt investigation, not automatic staffing cuts. Evaluate service requirements, sales volume, productivity, turnover and local wage conditions.
What Is a Good Restaurant Profit Margin?
There is no single good profit margin for every restaurant. The National Restaurant Association reported median 2024 income before tax of 2.8% of sales for full-service respondents and 4.0% for limited-service respondents. Those accounting figures are not identical to the calculator output when financing, tax, depreciation or owner compensation are excluded.
Judge a restaurant by repeatable profit, cash flow, debt capacity, reinvestment needs and risk, not by one percentage alone.
Keep Food and Menu-Price Assumptions Current
National Restaurant Association data published in July 2026 reported that the wholesale food price index was essentially unchanged from a year earlier in June but remained 35% above February 2020. Individual commodities moved in very different directions, so the effect depends on each menu mix.
Refresh food-cost, menu-price, wage, utility and delivery assumptions whenever market conditions or the concept changes. Dated industry context should never replace current invoices and sales records.
Ways to Improve Restaurant Profitability
Improvement can come from menu engineering, accurate recipes, portion control, inventory discipline, supplier negotiation, demand-based scheduling, reduced overtime, higher sales per labor hour, better channel pricing and tighter control of discounts and waste.
Prioritize changes by measurable contribution. A cost reduction that harms service or food quality can reduce repeat sales, while a price increase without demand analysis can lower volume.
Common Restaurant ROI Calculation Mistakes
Common mistakes include excluding pre-opening payroll and working capital, treating sales tax as revenue, using delivery revenue without commissions, omitting owner labor, ignoring payroll taxes, entering base rent without additional occupancy charges, annualizing the strongest month, and double counting startup costs as monthly expenses.
Another mistake is comparing the calculator result directly with an industry income-before-tax benchmark when the underlying cost definitions differ. Document every input and compare like with like.
Final Restaurant Investment Review Checklist
Before approving a restaurant investment, confirm the total startup cost, opening cash requirement, sales build-up, food and labor assumptions, lease obligations, delivery economics, repair reserves, financing payments and downside scenarios. Verify permits, equipment condition, utility capacity, local demand and competitive positioning.
Recalculate whenever sales mix, supplier prices, wages, delivery commissions, menu prices, opening hours, lease terms or equipment plans change materially.
Restaurant Profitability Sources and Data Notes
The guide uses the National Restaurant Association 2025 Operations Data Abstract and related public analysis for 2024 food, labor and profit comparisons; its July 2026 food-cost update for current price context; the U.S. Small Business Administration for startup-cost and break-even methodology; and ENERGY STAR for commercial foodservice equipment efficiency guidance. Industry statistics are dated comparison points, not guarantees or universal targets.
Official references: National Restaurant Association 2025 Operations Data Abstract, Restaurant food-cost indicators, SBA startup-cost guidance, SBA break-even guidance, and ENERGY STAR commercial foodservice equipment guidance.