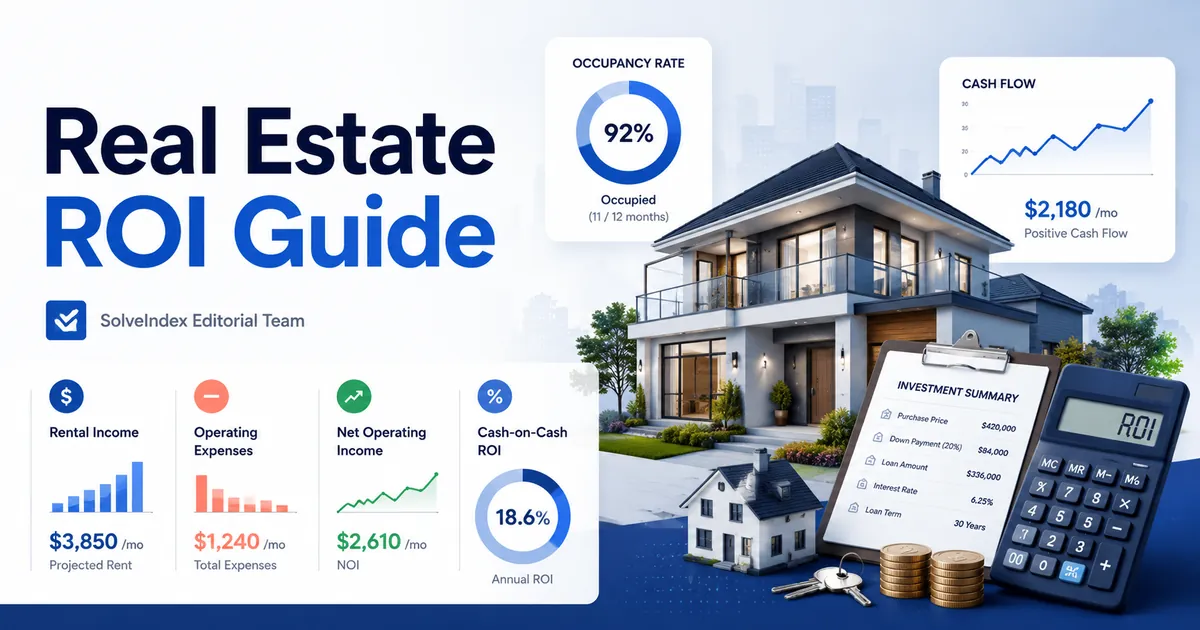
A rental property can produce rent, operating income, appreciation, mortgage principal reduction and eventual sale proceeds. These benefits do not all use the same denominator or occur at the same time. A useful analysis identifies which return is being measured, which expenses are included, whether financing is included, and whether the result is realized cash or only a forecast.
The SolveIndex calculator is intentionally a first-stage screening tool. It uses purchase price, down payment, annual gross rental income, annual operating expenses and an optional appreciation assumption. It does not model mortgage payments, closing costs, renovation cash, tax, depreciation or selling costs. Those boundaries are important when interpreting every output.
What This Rental Property ROI Calculator Measures
The calculator produces five connected property metrics. Gross rental yield is a quick rent-to-price screen. NOI shows the annual property income remaining after recurring operating expenses. Cap rate measures NOI against purchase price. The simplified pre-financing return compares NOI with the entered down payment. The final scenario adds projected annual appreciation to NOI before comparing the total with down payment.
The last two outputs are intentionally labeled as simplified or estimated. A complete leveraged property model would deduct annual debt service and use total cash invested, not only down payment. It would also model acquisition, renovation, reserve, tax and sale assumptions over the full holding period.
Rental Property ROI Formulas
These formulas should not be blended with a full cash-on-cash return or multi-year internal rate of return. The numerator and denominator must describe the same level of analysis. Property-level income belongs with property value for cap rate. Investor cash flow after debt service belongs with total investor cash for cash-on-cash return.
Worked Rental Property ROI Example
Assume a duplex costs $350,000, requires a $70,000 down payment, produces $32,400 of annual gross rent and has $9,000 of annual operating expenses. NOI equals $23,400. Gross rental yield is 9.26%, while cap rate is 6.69%. Dividing NOI by down payment produces a 33.43% simplified pre-financing return.
At an assumed 4% appreciation rate, projected annual appreciation is $14,000. Adding this to NOI creates a $37,400 screening return, or 53.43% of the down payment. This is not a realized or complete leveraged ROI because financing, acquisition and sale costs are absent.
| Metric | Calculation | Result |
|---|---|---|
| Gross rental yield | $32,400 / $350,000 | 9.26% |
| NOI | $32,400 - $9,000 | $23,400 |
| Cap rate | $23,400 / $350,000 | 6.69% |
| Simplified return | $23,400 / $70,000 | 33.43% |
| Projected appreciation | $350,000 x 4% | $14,000 |
| NOI + appreciation return | ($23,400 + $14,000) / $70,000 | 53.43% |
Gross Rental Yield
Gross rental yield divides annual gross rent by purchase price. It is useful for screening listings quickly because it requires only two inputs. It does not deduct taxes, insurance, vacancy, management, repairs, utilities or HOA costs, so it is not a profit margin.
A high gross yield can disappear after expenses. Compare gross yield only between properties with similar operating obligations, condition and local risk. A building with owner-paid utilities or substantial deferred maintenance may require a higher gross yield to produce the same NOI as a lower-maintenance property.
Net Operating Income in Real Estate
Fannie Mae defines net operating income for multifamily underwriting as effective gross income minus operating expenses. In practical rental analysis, NOI represents property-level income before mortgage financing, income tax, depreciation and major capital improvements.
Keep the time period consistent. Annual rent should be compared with annual expenses. Monthly statements can be annualized only when they represent normal activity and seasonality, vacancy and irregular expenses have been considered.
Gross Rent, Effective Income and Vacancy
Scheduled gross rent assumes the property is occupied and tenants pay as expected. Effective gross income reduces that amount for vacancy and credit loss, then may add recurring ancillary income such as parking, laundry or storage. The calculator accepts one annual rental-income figure, so decide whether it represents scheduled rent or expected collected income.
Account for vacancy once. If the income input already reflects expected vacancy, do not also include the same vacancy allowance in expenses. If the income is full-occupancy rent, include a realistic vacancy and credit-loss allowance with operating expenses.
Rental Property Operating Expenses
Recurring operating costs can include property taxes, landlord insurance, management, leasing, routine repairs, maintenance, landscaping, cleaning, pest control, security, licenses, inspections, accounting, legal support, HOA charges and utilities paid by the owner. Use property records and written quotes where possible.
Tax authorities in the United States, United Kingdom, Canada and Australia distinguish recurring expenses from capital improvements, although exact tax rules differ. The calculator is an economic screening model, not a tax-return model. A cost may affect cash return even when its tax treatment is spread across several years.
Repairs, Capital Improvements and Reserves
Routine repairs keep a property in normal operating condition. A roof replacement, major structural work, large renovation or improvement with a long useful life is economically different. It may not belong in one year's recurring NOI, but ignoring it can overstate long-term return.
Maintain a separate capital expenditure reserve or multi-year replacement schedule for roofs, HVAC systems, major appliances, paving, exterior work and other large items. When comparing properties, review both current NOI and the cash required to correct deferred maintenance.
Cap Rate Formula and Interpretation
Cap rate is an unlevered property-income yield. It helps compare similar income-producing properties before individual financing choices. Because it excludes mortgage debt service, two investors using different loans can still calculate the same cap rate from the same NOI and price.
Cap rate is not a complete risk score. A higher rate can reflect stronger income relative to price, but it can also reflect weaker location, short leases, poor condition, tenant concentration, uncertain occupancy or greater capital needs. Review the income assumptions and property-specific risk behind the percentage.
What Is a Good Cap Rate?
There is no universal good cap rate. The appropriate rate depends on local market pricing, property type, building age, lease quality, vacancy, operating risk, expected rent growth, interest rates and the investor's required return. Compare properties with similar uses and in the same market.
Fannie Mae's capitalization-rate guidance emphasizes market analysis, sales comparables and property-specific characteristics. That is why a national benchmark should not replace local comparable evidence or a professional appraisal.
How to Use an NOI Calculator Result
Use NOI to test whether rent covers recurring property operations and to calculate cap rate. Then compare actual NOI with seller-provided or broker-provided figures. Differences often come from vacancy assumptions, taxes after reassessment, management fees, utilities, insurance, repairs or omitted reserves.
A normalized NOI may adjust unusual one-time income or expenses, but every adjustment should be documented. Do not remove a recurring cost merely because it was unusually high during the last year.
Rental Yield in the UK, Australia, Canada and the US
The term rental yield is especially common in the UK and Australia, while US and Canadian investors also use cap rate and cash-flow metrics. Gross yield is usually the simpler rent-to-price percentage. Net yield may subtract some expenses, but definitions can vary between tools and markets.
Always read the formula rather than relying on the label. A calculator using annual rent divided by purchase price is reporting gross rental yield. A result based on rent after operating expenses is closer to a net property-income yield and should state which expenses were deducted.
Simplified Pre-Financing Return
This metric shows how large the property's NOI is relative to the entered down payment. It can be useful for first-stage screening, but the percentage can look unusually high because financing cost and other investor cash are missing.
Use the result only as a prompt for deeper analysis. A smaller down payment raises the displayed percentage even though it may also increase mortgage payments, refinancing risk and the chance of negative cash flow.
Cash-on-Cash Return vs the Calculator Result
Full cash-on-cash return normally deducts principal and interest payments from property cash flow and includes all cash invested, not only down payment. Total cash can include closing costs, lender fees, inspections, initial repairs, renovation, furnishing and reserves.
The calculator retains the internal result ID used by the website's JavaScript, but the visible label is deliberately different. Calling NOI divided by down payment full cash-on-cash return would overstate what the form actually calculates.
Total Cash Invested and Acquisition Costs
A purchase can require cash beyond the down payment. Include legal or settlement costs, lender fees, valuation, inspections, transfer charges, initial repairs, renovation, furnishing and working-capital reserves in a complete investor-level model.
Some costs are capitalized or treated differently for tax. That accounting treatment does not remove the cash requirement. For investment comparison, record when each amount is paid and whether it improves future income, reduces risk or only completes the transaction.
Debt Service and Cash Flow After Financing
Positive NOI does not guarantee positive investor cash flow. A high interest rate, short amortization period or small down payment can create annual debt service greater than NOI. Separate asset performance from financing performance.
Model interest-rate changes and refinance risk when a loan is variable, short-term or expected to mature before the planned sale. Financing can amplify gains, but it also increases required payments and downside exposure.
DSCR and Financing Risk
DSCR measures the margin between property income and required debt payments. A ratio above 1 means NOI exceeds debt service, while a ratio below 1 means property operations do not fully cover scheduled financing payments. Lender definitions and required thresholds vary.
DSCR is outside the current calculator because the form does not request loan amount, interest rate or amortization. Use a dedicated financing model before relying on the pre-financing return.
Property Appreciation in ROI
The calculator multiplies purchase price by the entered appreciation percentage. This applies the value change of the entire property to the investor's down payment, which can create a large percentage when leverage is high.
Appreciation is uncertain and can be negative. Local employment, supply, interest rates, zoning, infrastructure, property condition and buyer demand can change future value. Review the income-only result first, then test zero, expected and downside appreciation cases.
Realized vs Unrealized Property Return
Estimated appreciation is normally unrealized until the property is sold or refinanced. A sale can involve brokerage commissions, legal costs, taxes, repairs and concessions that reduce proceeds. Market estimates may also differ from the price a buyer ultimately pays.
Label appreciation separately from cash income. Combining both into one annual percentage is useful for scenario planning, but it should not be reported as cash received.
Mortgage Principal Paydown
Mortgage payments can increase equity by reducing loan principal. Principal paydown is not included in NOI because it is a financing item, and it is not included in the current calculator's estimated total return.
A multi-year equity model can add principal reduction to cash flow and net sale proceeds. Keep interest expense and principal paydown separate because they affect cash and tax analysis differently.
Tax, Depreciation and Jurisdiction Differences
Rental-income, interest, depreciation, capital works and deductible-expense rules vary across countries and ownership structures. IRS, HMRC, CRA and ATO guidance all distinguish rental income, recurring expenses and capital items, but the details are not interchangeable.
Do not convert the calculator's NOI directly into taxable income. Tax calculations may include interest, depreciation or capital allowances that are excluded from property-level NOI. Obtain local advice for ownership, filing, sale and cross-border issues.
Break-Even Occupancy
Break-even occupancy shows how much potential rent must be collected to cover expenses. The pre-debt version evaluates property operations. The after-debt version adds financing and is more relevant to investor cash survival.
Use realistic collected rent, not only advertised rent. Concessions, non-payment, turnover and seasonal vacancy can reduce effective income even when the unit is technically occupied.
Operating Expense Ratio
The expense ratio helps explain why two properties with similar gross yield produce different NOI. A rising ratio may indicate increasing taxes, insurance, maintenance, utilities or management costs.
Compare ratios only across similar property types and accounting definitions. A landlord paying all utilities will naturally report a different expense structure from a property where tenants pay them directly.
How to Compare Rental Properties
Use gross yield for an initial screen, NOI and cap rate for property-level economics, and debt-service cash flow for the actual financing plan. Compare verified rent rolls, leases, vacancy, taxes, insurance, maintenance history, planned capital work and management obligations.
Do not select the highest percentage without reviewing absolute cash profit and risk. A smaller property may show a high return but provide little total income or require disproportionate management time.
Single-Family, Multifamily and Commercial Differences
Single-family rentals may have concentrated vacancy because one empty unit removes all rent. Multifamily properties spread vacancy across units but can require more management and shared-area expenses. Commercial property analysis also depends heavily on lease length, tenant credit, renewal risk and which party pays taxes, insurance and maintenance.
Use the calculator for a basic income screen, then adapt the expense and risk model to the property type. A single formula cannot replace lease review, inspection or local market analysis.
Conservative, Expected and Stress Scenarios
Run at least three calculations. The expected case can use current market rent, supported vacancy, known expenses and a cautious appreciation assumption. The conservative case can reduce rent, increase vacancy and repairs, and set appreciation to zero.
A stress case can model prolonged vacancy, an insurance increase, emergency capital work or falling property values. A property that remains manageable without appreciation and with higher expenses usually has a larger margin of safety.
| Assumption | Conservative | Expected | Stress |
|---|---|---|---|
| Rent collected | Below current asking rent | Supported market rent | Reduced by vacancy or concessions |
| Operating expenses | Above recent average | Verified budget | Includes major unexpected increase |
| Appreciation | 0% | Locally supported estimate | Negative |
| Financing | Current quote | Expected loan | Higher rate or refinance pressure |
How to Review Negative NOI
Negative NOI means operating expenses exceed annual property income before financing. Check whether vacancy was double counted, whether a capital improvement was incorrectly entered as a recurring expense, and whether the rent period matches the expense period.
When the inputs are correct, negative NOI indicates that the property itself is not covering ordinary operations. Appreciation alone should not be used to hide an unsustainable income structure without a clear improvement plan and sufficient reserves.
Common Rental Property ROI Mistakes
- Calling gross rental yield profit or cap rate.
- Using scheduled rent while omitting vacancy and credit loss.
- Excluding management because the owner plans to self-manage.
- Treating NOI divided by down payment as full cash-on-cash return.
- Ignoring closing costs, renovation cash and capital reserves.
- Including optimistic appreciation as guaranteed cash return.
- Comparing properties from different markets or property types using one universal cap-rate benchmark.
- Using tax deductions as substitutes for economic expenses.
Rental Property ROI FAQs
Sources and Methodology
The property-income methodology was checked against the Fannie Mae Multifamily Guide definition of NOI and its capitalization-rate derivation guidance. Rental-income and expense treatment was reviewed using the IRS rental real estate guidance, GOV.UK landlord expense guidance, Canada Revenue Agency rental income guide and Australian Taxation Office rental property guidance.
The calculator remains a simplified, country-neutral screening model. It does not apply jurisdiction-specific tax rules or produce an appraisal, lending decision, inspection result or investment recommendation.